Pixee Enterprise Server Documentation
Welcome to the Pixee Enterprise Server documentation. This guide will help you install, configure, and operate Pixee Enterprise Server in your environment.
Overview
Pixee Enterprise Server is a self-hosted solution that brings the power of automated code improvements directly to your infrastructure. It analyzes your codebase, identifies potential improvements, and automatically generates pull requests with fixes and enhancements.
Getting Help
If you encounter issues during installation or operation:
- Check the FAQ section for common solutions
- Review the troubleshooting sections in the installation guides
- Contact our support team with detailed information about your environment and the issue
Installation
Installation Overview
Pixee Enterprise Server is a self-hosted solution that brings pixee.ai into a customer's infrastructure.
Installation Methods
There are currently two methods available for installing Pixee Enterprise Server:
This option provides the most streamlined installation, configuration, update, and support experience. This is the recommended method of installation for Pixee Enterprise Server as it provides a user-friendly interface for installation, configuration and enhanced troubleshooting capabilities.
This option allows users to deploy Pixee Enterprise Server into a managed kubernetes cluster.
Prerequisites
Before installing Pixee Enterprise Server, you'll need to provision the necessary infrastructure.
Common Requirements
Database
For trial installations you can use the embedded database and skip this section. For production environments, we recommend creating an external database:
- PostgreSQL 17.4+
- 10Gb+ available disk space
- Network connectivity between Pixee Enterprise Server Kubernetes cluster and database
- Create database named
pixee_platform(or any name you choose) - Create user with permissions to
pixee_platformdatabase
External Object Store
You can configure Pixee Enterprise Server to use an external object store. If you prefer to use the in-cluster, embedded object store, you may skip this section.
Requirements
The following are requirements of an external object store compatible with Pixee Enterprise Server:
- The object store and the Kubernetes cluster are able to communicate over the network
- The object store exposes a S3 compatible API
- A bucket has been created for use as the
pixee-analysis-inputbucket
AI Providers
Advanced AI capabilities are required. Please review the AI Providers documentation for more information for supported AI providers in Pixee Enterprise Server.
Infrastructure Requirements
Create a VM with the following specifications:
- Linux distro: Ubuntu 24.04+ (recommended) or Enterprise Linux 9 (RHEL 9, Rocky Linux, AlmaLinux)
systemdinstalled- For Enterprise Linux 9: SELinux enforcing mode is supported on a standard SELinux policy. STIG- or CIS-hardened images are not supported or tested
- Allows traffic to egress to the internet (more details here)
- Allows HTTPS traffic to ingress to port 443
- Allows HTTPS traffic to ingress to port 30000 (for embedded cluster admin console)
- 8 vCPU, 32 GB RAM
- 100GB+ disk with <10ms write latency (i.e. SSD/NVME)
Splitting /var onto its own volume
If you install with --data-dir on a large volume while /var stays on a small
separate one, kubelet still writes every container's log output under /var/log,
where its disk-pressure protection cannot see it. Relocate the pod log directory
as part of the install — see Pod Log Storage.
A single-root layout needs nothing.
DNS Configuration: Create the appropriate DNS records so that a domain name resolves to your provisioned virtual machine.
TLS Certificate: To encrypt traffic to Pixee Enterprise Server, you'll need to generate/acquire a TLS certificate for use with your selected domain name. With the Embedded Cluster installation method, Pixee Enterprise Server can automate the TLS certificate request using LetsEncrypt or self-signed certificates as part of the configuration process.
Select or create a Kubernetes cluster with the following available to Pixee Enterprise Server:
- Kubernetes v1.33–v1.35 (tested on v1.33)
- 8+ vCPU
- 32+ GB RAM
- 100GB+ disk with <10ms write latency (i.e. SSD/NVME)
- Allow outgoing HTTP traffic to the internet (more details here)
- Allow incoming HTTPS traffic to port 443
- (optional) ingress controller installed and configured
Kubernetes version
Pixee Enterprise Server bundles Envoy Gateway v1.8 to power ingress routing, security policy, and authentication. Envoy Gateway v1.8 supports Kubernetes v1.32–v1.35; Pixee Enterprise Server ships and is tested on v1.33, so we recommend running v1.33–v1.35. Newer Pixee Enterprise Server releases may bundle a newer Envoy Gateway with a different supported range — check the Envoy Gateway compatibility matrix when upgrading.
DNS Configuration: Create the appropriate DNS records so that a domain name resolves to your Kubernetes cluster.
TLS Certificate: To encrypt traffic to Pixee Enterprise Server, you'll need to generate/acquire a TLS certificate for use with your selected domain name. With Helm, you have multiple options for TLS certificate management: using cert-manager to automatically provision TLS certificates, using pre-existing TLS certificates as Kubernetes secrets, or terminating TLS outside the cluster (i.e., via a load balancer).
Additional Helm Requirements:
- Kubectl installed and configured to access the target cluster
- Helm CLI installed (version >3.15)
- preflight and support-bundle plugins from troubleshoot.sh installed in the target cluster
- Access to image registry (images.pixee.ai) from Kubernetes cluster
Tip
If you need to pull images from an internal registry, you will need to update your values.yaml to override the registry and pullSecrets values for all images listed in the reference section identified by the patterns **.image.registry and **.image.pullSecrets. In addition, if your registry requires authentication you will need to create a dockerconfigjson type secret to authenticate with your internal registry in the pullSecret value for each image.
Installation Instructions
Installation
To install using Embedded Cluster follow:
-
From your virtual machine, download the Pixee installer:
curl -f "https://distribution.pixee.ai/embedded/pixee/<release channel>" -H "Authorization: <your license ID>" -o pixee.tgz -
Extract the Pixee installer:
tar -xvzf pixee.tgz -
Run the Pixee installer:
sudo ./pixee install --license license.yamlInfo
The directory used for data storage can be changed by passing the --data-dir
-
You will be prompted to set an admin password, this password will grant access to the admin console later
-
When the installer completes, visit the admin console url in your browser:
https://<domain name or vm ip>:30000 - You may receive a self-signed certificate warning from your browser, this is expected
-
If you have a domain name and TLS certificate available you can configure the admin console to use them by following the prompts, or you can
-
The admin console will then load the configuration page. You will be directed through a workflow that will step you through configuring Pixee Enterprise Server.
To install using Helm Deployment follow:
-
Authenticate against the Pixee Helm Registry:
helm registry login registry.pixee.ai --username <your email address> --password <your license key> -
Preflight checks - If there are any known issues that would prevent successful installation, the preflight checks will report them. To run the preflight checks:
Pass the samehelm template oci://registry.pixee.ai/pixee/<release channel>/pixee-enterprise-server --values values.yaml -n pixee-enterprise-server | kubectl preflight --nyou will install into: cluster resources are collected from the release namespace, and without it they are gathered fromdefaultinstead.If there are no issues, or you are able to address all reported issues, continue with the installation using helm.
Preflight checks cover cluster readiness and configuration only. Checks that authenticate to an external service — your AI provider, SonarQube, an external database, SMTP, AppScan — deliberately do not run here, because preflights execute before the release is deployed and the credentials are not yet available to them.
-
Helm install - Execute helm against the Kubernetes cluster to install, be sure to replace your release channel below (likely
stableorunstable):helm upgrade --install pixee-enterprise-server oci://registry.pixee.ai/pixee/<release channel>/pixee-enterprise-server -f values.yaml -n pixee-enterprise-server --create-namespace -
Install the documentation site (optional) - The MkDocs-rendered Pixee documentation site ships as a separate sibling chart. Helm does not install sibling charts automatically, so install it explicitly:
helm upgrade --install pixee-enterprise-server-docs oci://registry.pixee.ai/pixee/<release channel>/pixee-enterprise-server-docs -f values.yaml -n pixee-enterprise-server -
Install the analytics dashboards (optional) - The Superset dashboard payload + post-install import Job also ship as a separate sibling chart. Install only when you have Superset enabled in the main chart's values:
helm upgrade --install pixee-enterprise-server-dashboards oci://registry.pixee.ai/pixee/<release channel>/pixee-enterprise-server-dashboards -f values.yaml -n pixee-enterprise-server
The dashboards chart references the Superset Service and platform-database Secret created by the main chart, so install it into the same namespace and after the main chart's Superset pods are running.
Tip
Be sure to replace <release channel> with your actual assigned channel, this is likely stable or unstable. All three charts (main, docs, dashboards) are version-locked and released together — use the same chart version for each.
Initial Configuration
After installation, you'll need to configure Pixee Enterprise Server. This page covers the first three sections of the admin console: how browsers reach the server, how users sign in, and which AI provider it uses.
Configuration
Configuration is done through the admin console configuration page available after installation at:
https://<domain name or ip address>:30000
When you load the admin console page you will be prompted to enter your admin password. The first time configuring after installation you will be directed through a workflow that will step you through configuring Pixee Enterprise Server.
Network
The settings under the Network Settings section all require your input. Together they describe how browsers reach your Pixee Enterprise Server, and the console reveals each option as your earlier answers make it relevant. Make sure you review all of them for completeness and accuracy. Authentication and AI model provider settings follow in their own sections.
The section asks its questions in the order they depend on one another:
- Domain name — the address browsers use.
- Behind a reverse proxy, load balancer, or CDN — whether anything sits between browsers and this server.
- TLS Termination — shown only when you answer yes to the previous question.
- Protocol, and the TLS Options that follow from it.
- Use non-standard port? — and the port itself, when browsers do not reach the server on 80 or 443.
Domain
Enter the domain name browsers use to reach your Pixee Enterprise Server. Behind a reverse proxy, load balancer, or CDN this is the public hostname clients request — not the server's own address, and not the origin address the proxy was configured with.
Two things depend on it. Pixee builds every browser-facing URL from this value, including the OIDC authorization endpoint and the OAuth2 redirect_uri, so an internal address here sends the login flow to a host the browser cannot reach. It is also the only Host header the server's gateway accepts, so your proxy must forward requests carrying this hostname. See Reverse Proxy Settings.
If you have not assigned a domain name you can enter the public IP address of your Pixee Enterprise server instead but this will limit your TLS options.
Reverse proxy
Check Behind a reverse proxy, load balancer, or CDN when browsers reach this server through an ALB, Azure Front Door, Application Gateway, HAProxy, or similar, rather than connecting to the server directly. Answering yes reveals two further settings:
- TLS Termination — at this server, at the reverse proxy, or nowhere. This decides the scheme in every browser-facing URL, so a proxy that terminates TLS still produces
https://login redirects even when the server itself serves HTTP. - Additional accepted hostnames — a fallback for proxies that rewrite the
Hostheader and cannot be reconfigured.
Both are covered in depth under Reverse Proxy Settings.
Protocol
Select the protocol this server's own gateway serves. With nothing in front of it, this is also the protocol browsers use. Behind a reverse proxy it is what the proxy connects to, and it has to agree with TLS Termination:
| TLS Termination | Protocol |
|---|---|
| TLS at this server | HTTPS — the proxy forwards encrypted traffic |
| TLS at reverse proxy | HTTP, or HTTPS if your proxy re-encrypts to the origin |
| No TLS (HTTP only) | HTTP |
Choosing HTTP leaves traffic to this cluster un-encrypted, which is appropriate for quick testing and for the common arrangement where a proxy terminates TLS in front. Choosing HTTPS prompts you for TLS Options: upload your own certificate, have the cluster generate a self-signed one, or have Let's Encrypt issue and renew one for you.
HTTPS pins browsers to HTTPS for a year
An HTTPS gateway sends Strict-Transport-Security: max-age=31536000; includeSubDomains on every response. A browser that has loaded the site once then refuses plain HTTP to that hostname and its subdomains for a year, even if you later switch that hostname back to HTTP. That is HSTS working as intended rather than a fault, so plan any downgrade of a hostname with it in mind. The header is not sent when the cluster generates a self-signed certificate, since pinning HTTPS to a certificate the browser rejects would leave no way back into the console.
The header is also withheld when Use non-standard port? is set. A pin is recorded against the hostname alone, with no port attached, and a pinned browser rewrites the scheme while keeping whatever port it was given: http://host:30080 would become https://host:30080 and fail against the plaintext listener instead of following the redirect. The same pin would upgrade every other plain-HTTP service on that hostname and its subdomains, on any port, for a year, with no way to withdraw it.
Use non-standard port?
Leave this unchecked when browsers reach the server on the standard ports, 80 for HTTP and 443 for HTTPS. Check it when they do not — a load balancer listening on 5443, or a deployment reached on a NodePort such as 30080 — and enter the port in Non-standard port. The port is appended to every browser-facing URL, including the OIDC login redirects, so entering it here is what puts it into the authorization endpoint and the redirect_uri. It applies whether or not a reverse proxy is configured. See Non-Standard Port.
Authentication
Pixee Enterprise Server authenticates through Authentik, the embedded identity provider. Use Authentik on its own, or federate your existing IdP through it (Microsoft Entra ID, Okta, Google Workspace, Oracle, LDAP).
Once Authentik is running, this section lists the default admin credentials, the Authentik admin console URL, and the direct login link for administrators, the URL local accounts such as akadmin use to reach a password form when a federated IdP is configured with auto-redirect.
See Authentication for more information on specific provider configuration.
AI Providers
Choose LLM provider and fill in the credentials. Pixee uses two models — a Reasoning Model for complex analysis and a Fast Model for quick tasks (they can be the same). Sensible defaults are pre-filled.
Supported providers: OpenAI, Azure AI Foundry, Anthropic, Azure Anthropic, and AWS Bedrock. OpenAI and Anthropic only require an API Key; the Azure variants also require an Endpoint, and Bedrock an AWS Region.
Selecting AWS Bedrock reveals a second choice, Bedrock API: Mantle (the default) for OpenAI's frontier models, or Converse for the models AWS hosts natively. The two APIs are incompatible and take different model IDs, so the console asks for the credentials and model names of whichever one you pick.
For OpenAI-compatible providers such as Databricks, select OpenAI and set the Endpoint to your workspace serving URL. See Databricks AI.
See AI Providers for per-provider walkthroughs and web search model configuration.
Create a values.yaml file and configure the following basic settings:
Domain
Set the URL where your Pixee Enterprise Server will be accessible (if no domain name is available, use an external IP address):
global:
  pixee:
    domain: "<your pixee enterprise server domain name>"
Protocol
Set the HTTP protocol (http or https) used to access your Pixee Enterprise Server:
global:
  pixee:
    protocol: "https"
Info
protocol is what this cluster serves. When TLS is terminated outside the cluster, leave it at http and set externalProtocol: "https" alongside it — that is the scheme browsers use, and it is what the browser-facing URLs are built from. See Reverse Proxy Settings.
Ingress
If you are using an ingress controller, you can enable and configure the Pixee Enterprise Server ingress resource as follows:
platform:
  proxy:
    # enable proxy configuration with ingress to allow headers from the ingress controller
    enabled: true
  ingress:
    enabled: true
    className: "<your ingress controller class name (i.e. nginx, gce, etc)"
    hosts:
      - host: "<your pixee enterprise server domain name>"
        paths:
          - path: "/"
            pathType: "Prefix"
    # If you are securing your Pixee Enterprise Server with TLS via ingress, set the following
    tls:
      - hosts:
        - "<your pixee enterprise server domain name>"
        secretName: "<your tls certificate secret name>"
AI Model Provider
Select the AI provider you want to use and set the API key, endpoint (if required), and model names. Pixee uses two models: reasoning for complex analysis and fast for quick tasks — these can be the same model.
global:
  pixee:
    ai:
      enabled: true
      default:
        provider: "openai"
        apiKey: "<your OpenAI API key>"
      reasoning:
        model: "gpt-5.4-mini"
      fast:
        model: "gpt-5.4-mini"
Info
For OpenAI-compatible providers such as Databricks, set default.endpoint to your workspace serving URL. See Databricks AI.
global:
  pixee:
    ai:
      enabled: true
      default:
        provider: "azure"
        apiKey: "<your Azure AI Foundry API key>"
        endpoint: "<your Azure AI Foundry endpoint>"
      reasoning:
        model: "gpt-5.4-mini"
      fast:
        model: "gpt-5.4-mini"
global:
  pixee:
    ai:
      enabled: true
      default:
        provider: "anthropic"
        apiKey: "<your Anthropic API key>"
      reasoning:
        model: "claude-sonnet-4-20250514"
      fast:
        model: "claude-sonnet-4-20250514"
global:
  pixee:
    ai:
      enabled: true
      default:
        provider: "azure-anthropic"
        apiKey: "<your Azure Anthropic API key>"
        endpoint: "<your Azure Anthropic endpoint>"
      reasoning:
        model: "claude-sonnet-4-20250514"
      fast:
        model: "claude-sonnet-4-20250514"
global:
  pixee:
    ai:
      enabled: true
      default:
        provider: "bedrock-mantle"
        apiKey: "<your AWS Bedrock API key>"
        endpoint: "https://bedrock-mantle.us-east-1.api.aws/openai/v1"
      reasoning:
        model: "openai.gpt-5.6-luna"
      fast:
        model: "openai.gpt-5.6-luna"
Info
The Responses API is enabled automatically for this provider. See AWS Bedrock (Mantle).
For advanced settings (web search model, custom headers, Responses API, using an existing secret), see AI Providers.
Authentication
Pixee Enterprise Server authenticates through the embedded Authentik identity provider. To use your own IdP, connect it to Authentik as a federated source — there is no direct platform-to-IdP integration to configure. You point Authentik at your IdP, and the platform talks to Authentik.
Info
Support for OIDC compatible identity providers is in active development, contact support@pixee.ai to request additional support.
Embedded Identity Provider (Authentik)
Pixee Enterprise Server includes Authentik as an embedded identity provider. This provides a full-featured identity management solution without requiring an external OIDC provider.
Features
- User management with web-based admin interface
- Support for local users and passwords
- Federation with external identity providers (Google Workspace, Oracle, etc.)
- Self-service password change
- Session management
- Pixee-branded login experience
Email / SMTP Support
To enable email features such as self-service password reset, email verification, and notification emails, configure the SMTP / Email Settings section in the admin console. An SMTP server (e.g., your organization's mail relay, Gmail, SendGrid) is required. Without SMTP configured, password resets must be performed by an administrator through the Authentik admin interface or by using the recovery key command described below.
Configuration
Authentik initializes on deployment with the Pixee OIDC application pre-configured. The admin console shows the default admin credentials and the direct login link for administrators under Config → Authentication.
To enable Authentik in Helm deployments, set the following in your values.yaml:
authentik:
  enabled: true
  authentik:
    secret_key: "<generate a secure random string - must not change after install>"
    bootstrap:
      password: "<initial admin password for akadmin user>"
    postgresql:
      host: "<postgresql-host>"
      name: "authentik"
      user: "authentik"
      password: "<database-password>"
    redis:
      host: "<redis-host>"
      port: 6379
  # Inject the OIDC client secret into the Authentik worker so the blueprint can
  # read it via !Env. References the same secret used by the platform.
  worker:
    env:
      - name: PIXEE_OIDC_CLIENT_SECRET
        valueFrom:
          secretKeyRef:
            name: oidc-client-secrets
            key: secret

global:
  pixee:
    access:
      enabled: true
      oidc:
        client:
          id: "pixee"
          secret: "<generate a secure random string>"
Initial Setup
After deploying:
-
Access the admin interface by navigating to:
https://<your-domain>/authentik/Log in with username
akadminand the password shown in the admin console config page (your license ID). After logging in, click the Admin interface button to access user management. -
Change the admin password (recommended) - Navigate to Directory > Users, select
akadmin, and update the password. This change will persist across upgrades. -
Create additional users as needed through the Authentik admin interface
-
Find the admin password in your
values.yamlunderauthentik.authentik.bootstrap_password -
Access the admin interface by navigating to:
https://<your-domain>/authentik/Log in with username
akadminand the configured password, then click the Admin interface button. -
Create additional users as needed through the Authentik admin interface
Recovery Access
If you need to reset a user's password, the easiest way is to create a recovery link from the Authentik admin UI:
- Navigate to Directory → Users and select the user
- Click Create Recovery Link — you can set how long the link stays valid (default: 30 minutes)
- Send the link to the user; they will be prompted to set a new password
As a CLI fallback, you can generate a recovery link via kubectl:
kubectl exec -n <namespace> deploy/<release-name>-authentik-server -- ak create_recovery_key 30 akadmin
This generates a recovery URL valid for 30 minutes.
Upgrades and Persistence
- User accounts, passwords, and settings are stored in the Authentik database and persist across upgrades
- Password changes made by users or admins will not be overwritten during upgrades
- The OIDC application configuration is managed declaratively and will be updated automatically during upgrades
Using Authentik behind a load balancer on a non-standard port
If your Pixee Enterprise Server is accessed through a load balancer on a non-standard port (e.g., port 5443), you must configure the reverse proxy settings for OIDC authentication to work correctly. See Reverse Proxy Settings — Non-Standard Port for setup instructions.
Admin Access — the pixee-admins Group
The pixee-admins Authentik group is the single source of truth for privileged access in Pixee Enterprise Server. Members of this group receive admin rights on two surfaces:
- User Platform — full organization admin access (manage repos, users, settings)
- Superset Dashboards — Superset Admin role (manage datasets, database connections, roles)
Users not in pixee-admins sign in to Superset as Gamma (read-only dashboard viewers with access to the Pixee Platform database).
Superset role changes apply at next login
Superset recomputes a user's roles when they sign in, so adding someone to pixee-admins — or removing them — reaches a signed-in user only on their next login.
Roles set in the Superset UI are replaced on login
AUTH_ROLES_SYNC_AT_LOGIN is enabled, so Authentik group membership is the only role knob for SSO users. Any role assigned manually inside the Superset UI — including sql_lab — is silently overwritten the next time that user logs in. Make role decisions in Authentik, not in Superset.
Default membership
akadmin (the Authentik bootstrap superuser) is seeded into pixee-admins automatically as a break-glass account:
- Fresh installs —
akadminis added by the Authentik blueprint on first deploy. - Upgrades from earlier versions —
akadminis added by a one-time Helm hook Job on the first upgrade that includes this feature. If the Authentik blueprint had not yet applied at the time of that upgrade, the Job exits with an error visible in the Kubernetes Job logs. Verify membership after upgrade using the Adding a user topixee-adminssteps below, and addakadminmanually if needed.
You should add your operational user accounts to this group and avoid using akadmin for day-to-day work.
Adding a user to pixee-admins
- In the Authentik admin interface, go to Directory → Groups
- Click on pixee-admins
- On the Users tab, click Add existing user and select the user
- Click Add — changes take effect on the user's next login
Enforcing the admin role
Membership in pixee-admins is only acted upon in Resolution Center once role enforcement is turned on. Enforcement is off by default: every signed-in user has full access in Resolution Center, which is how Pixee behaved before roles existed. Superset is not governed by this toggle — it always maps pixee-admins to Superset Admin and everyone else to Gamma, as described at the top of this section.
Populate pixee-admins first
With enforcement on, editing organization preferences is restricted to members of pixee-admins. If the group holds only akadmin, that break-glass account is the only one that can make those changes.
- Navigate to the admin console, select the
Configtab, then go to theAuthenticationsection - Select Enforce role-based access control
- Save and deploy the configuration
global:
  pixee:
    access:
      enabled: true
      authorization:
        enabled: true
Enforcement requires authentication. With access.enabled false the platform logs a warning and leaves enforcement off, since there is no authenticated user whose roles it could check.
User Management
Users are managed through the Authentik admin interface at https://<your-domain>/authentik/if/admin/.
Creating Users
- In the admin interface, go to Directory → Users and click Create
- Fill in the user's details (username, display name, email) and click Create
- After creating the user, select them and click Create Recovery Link to generate a one-time password setup link — you can choose how long the link stays valid
- Send the recovery link to the user; they will be prompted to set their password on first visit
For more details, see the Authentik documentation on creating users and creating recovery links.
Editing and Deleting Users
- Go to Directory → Users, select a user, and update their details or deactivate their account
- Users created here can log in to Pixee Enterprise Server
Federating External Identity Providers
Authentik supports federating external identity providers so users can log in with their existing corporate credentials. After creating a source for your identity provider (see provider-specific sections below), you must add it to the login page.
Works behind a corporate egress proxy
Authentik honors the standard HTTP_PROXY / HTTPS_PROXY / NO_PROXY environment variables. When you configure an outbound HTTP proxy in the admin console, those values flow through to Authentik automatically, so back-channel calls to your identity provider (token exchange, userinfo, JWKS) route through the proxy. The no_proxy exclusion list is also honored if you need certain hosts to bypass the proxy.
Choosing a setup method
Each provider below can be set up three ways. They reach the same result and are interchangeable (the CLI applies the very same blueprint you would run in the UI), so pick based on the access you have:
| Method | Automation | Access needed | Best when |
|---|---|---|---|
CLI (pixee-idp) |
Fully automated. One command creates the source and mappings and puts it on the login page | Cluster / kubectl |
You have shell access and want the fewest steps (e.g. a Pixee-assisted screen-share) |
| Authentik UI (run the blueprint) | Mostly automated. The shipped blueprint creates the source and mappings; you add it to the login page by hand | Authentik web admin only | Identity admins without cluster access, or a GitOps/auditable flow |
| Manual (by hand) | Fully manual. You build the source, mappings, and login binding yourself | Authentik web admin only | Advanced or unsupported setups the other two do not cover |
Each provider's Step 2 presents these as tabs. If you will use the CLI, set up its alias once (The pixee-idp CLI, below); the UI and manual methods need no cluster access.
The pixee-idp CLI
Several provider setups below offer a CLI method that automates the Authentik-side wiring. It uses pixee-idp, an in-cluster helper that spins up a short-lived pod per command and tears it down. Nothing is installed on a host and no credential is stored in the chart or admin console. Set it up once, then use it for any provider (connect, emit, status, auto-redirect).
The helper ships automatically whenever the embedded Authentik broker is in use; there is no separate toggle. (Plain Helm deployments activate it by supplying a scoped token: --set authentik.federation.pixeeIdp.token=<token>, or point at your own with authentik.federation.pixeeIdp.existingSecret.)
Open a cluster shell and define the alias:
# From the Pixee Enterprise Server virtual machine
sudo ./pixee shell
pixee-idp() { sh -c "$(kubectl get cm pixee-idp-launcher -n kotsadm -o 'jsonpath={.data.pixee-idp}')" pixee-idp "$@"; }
(Helm deployments: run the alias from any shell with kubectl access to the release namespace, replacing kotsadm.)
You can then run pixee-idp emit <provider> (no credentials needed) to print a provider's redirect URI and prerequisites. The provider-specific CLI tabs below assume this alias is defined.
Adding a Source to the Login Page
This step is the same for all federated identity providers. After creating a source in Authentik:
- In the Authentik admin interface, go to Flows and Stages → Flows
- Click on default-authentication-flow
- Go to the Stage Bindings tab
- Click Edit Stage on the default-authentication-identification stage
- Under Source settings, add your identity provider source to the Selected sources field
- Click Update to save
Users will now see the identity provider as a login option on the Authentik login page. Settings made on this stage (selected sources, user fields, recovery flow) are preserved across deploys — the Pixee Helm chart does not overwrite them. To redirect users directly to the identity provider instead of showing a selection page, see Auto-Redirect to Identity Provider. To show a self-service password recovery link, see Enable "Forgot Password?" Link on the Login Page.
Granting the Pixee Admin Role
Pixee's role-based access control is driven by Authentik group membership, independent of which identity provider a user signs in through. The chart ships an Authentik group named pixee-admins: any user in it receives the Pixee admin role (Pixee reads this from the pixee_roles claim Authentik adds to the token). Users who are not in the group sign in as regular, non-admin users.
To grant a federated user the admin role, add them to pixee-admins using whichever approach fits your identity provider:
- Assign membership directly in Authentik (works for any provider). Go to Directory → Groups → pixee-admins → Users → Add existing user, and add the user. This is the simplest option and a good fit when only a handful of people need admin.
- Map an upstream group by name (for providers that send groups). If your identity provider includes group membership in its token (e.g. Microsoft Entra, Okta, Oracle), name a group
pixee-adminson the provider side and set the source's Group matching mode to Link to a group with identical name (name_link). Authentik then keeps membership in sync with your IdP automatically. Some providers need one setting turned on before they send groups at all: see Okta, Entra, and Oracle. Google is the exception — it omits group membership from OIDC tokens, so use group → admin sync (a Directory API lookup) or add admins directly.
The group starts empty
On a fresh install no federated user has the Pixee admin role until you add them to pixee-admins. Add your first administrator before relying on a federated identity provider for admin access. (The built-in akadmin account can always sign in via the direct-login flow to manage groups.)
Federated Users Are Made Internal Automatically
Authentik distinguishes internal users (full members who can reach the Application Dashboard and manage their own API tokens) from external users (redirected straight to their default application, with no dashboard access). Users enrolled through an external identity provider (IdP) are frequently created as external, which locks them out of the dashboard.
Pixee Enterprise Server handles this for you in two ways, with no configuration required:
- New users arrive internal at enrollment. Authentik's default source-enrollment flow otherwise creates users as external; the Pixee blueprint overrides that flow's User Write stage to create internal users instead.
- Existing users are converted by a deploy job that sweeps federated users (external and linked to a source) to internal. It is scoped to source-linked users, so local accounts (such as
akadmin) and service accounts are never touched.
Custom enrollment flows
The new-user override applies to the default source-enrollment flow, which is what OAuth and SAML sources use unless you change it. If you point a source at a custom enrollment flow, set that flow's User Write stage "User type" to Internal in the Authentik UI — the deploy job will also catch such users on the next deploy.
Disable Self-Service for Federated Users
When an external IdP owns your users' credentials and profiles, Authentik's self-service "Change password" and "Update details" controls no longer apply. You can hide them with a single toggle.
In the admin console, select the Config tab, enable "Disable Authentik self-service", then save and deploy.
Set the following in your values.yaml and upgrade:
authentik:
  disableSelfService: true
When enabled:
- the "Change password" card is hidden;
- the "Update details" form is hidden (the user-settings flow is removed from the brand).
These are applied declaratively, so turning the toggle off re-enables them (restores Authentik's defaults). Leave it off for local/embedded-user setups, where users manage their own accounts through these same controls.
Administrators and MFA
Administrators can still set or reset local-account passwords under Directory → Users, and the "Forgot password?" recovery flow still works. This toggle does not hide the MFA device cards: Authentik renders them whenever the authenticator setup stages exist, with no per-user setting to remove them. Whether federated users are challenged for local Authentik MFA depends on your source's authentication flow and any bound policies (it is not skipped automatically); their identity provider enforces its own MFA upstream regardless.
Optional: Customize Username Derivation
By default, Authentik populates each new federated user's username from the OIDC preferred_username claim — typically the full UPN (e.g. john.smith@example.com). To derive a shorter username from the email or UPN claim instead (e.g., john.smith from john.smith@example.com):
- In the Authentik admin interface, go to Customization → Property Mappings → Create → OAuth Source Property Mapping
-
Configure the mapping with one of the following, depending on your identity provider:
- Name:
Google Email to Username -
Expression:
return {"username": info.get("email", "").split("@")[0]}
- Name:
Entra UPN to Username -
Expression:
# Authentik's Entra type reads Microsoft Graph fields
# (userPrincipalName, mail, displayName) — NOT the standard OIDC
# claims (preferred_username, email). Derive the username from the
# UPN, and fall back to the UPN for email when the account has no
# mailbox (mail is null — common for bare *.onmicrosoft.com users).
upn = info.get("userPrincipalName")
mail = info.get("mail") or (info.get("otherMails") or [None])[0]

return {
    "username": upn,
    "email": mail or upn,
    "name": info.get("displayName", ""),
}
The
mail-to-upnfallback matters because the source matches users on email (email_link): ifmailis null and nothing is supplied, Authentik refuses the login with "authenticate with the source you've previously signed up with" (see the troubleshooting table below). Falling back to the UPN — which is already email-formatted — gives every account a usable email. This is the same mapping the shipped Pixee - Entra ID federation blueprint and thepixee-idpCLI bind automatically, so you only need to create it by hand for a fully manual setup. - Name:
-
Click Finish
- Go to Directory → Federation and Social login → edit the OAuth source for that identity provider
- Under User Property Mappings, add the mapping you just created to the Selected User Property Mappings field
- Click Update
New users will now be assigned a username automatically based on the identity provider's claim.
Troubleshooting Property Mappings
Most installs work without any custom mapping — Authentik's built-in extraction reads preferred_username, name, and email from any standard OIDC source and populates the user record automatically. The mapping above is only needed if you want a different username derivation (e.g. stripping the @<host> suffix).
If sign-in fails with "Aborting write to empty username" or new user records have empty fields:
-
Inspect what the IdP actually returned, by temporarily adding a debug log line to the property mapping's Python expression.
Open the Authentik admin UI at
https://<your-domain>/authentik/if/admin/and navigate to Customization → Property Mappings. Click on the mapping you want to debug — the edit panel opens on the right. The form has several fields; the one you want is the multi-line Expression text area, which contains the Python code that runs during sign-in.Before (the expression you already have, for example):
upn = info.get("preferred_username") or info.get("email")
return {"username": upn.split("@")[0] if upn else None}
After — add
ak_logger.warning(...)as the first line. The existing code stays underneath, untouched:ak_logger.warning("oauth source claims", info_keys=list(info.keys()), info=dict(info)) upn = info.get("preferred_username") or info.get("email") return {"username": upn.split("@")[0] if upn else None}Click Update to save. Then attempt a sign-in — the expression runs and writes a structured JSON log line to the
authentik-serverpod's stdout.About
ak_loggerak_loggeris a Python name pre-injected into every Authentik property-mapping expression (alongsideinfo,properties,request). It's not a CLI tool or a script file; it only exists inside the Expression text area when Authentik evaluates the mapping. See Authentik's Sources expression property mappings reference for the full list of available names and other example debug snippets.Read the resulting log line from the
authentik-serverpod:# From the Pixee Enterprise Server virtual machine sudo ./pixee shell kubectl logs -n kotsadm \ -l app.kubernetes.io/component=server,app.kubernetes.io/name=authentik \ --tail=200 | grep "oauth source claims"kubectl logs -n <namespace> \ -l app.kubernetes.io/component=server,app.kubernetes.io/name=authentik \ --tail=200 | grep "oauth source claims"Replace
<namespace>with the namespace you installed the chart into (oftendefault).The matching line is a JSON object. The first positional argument to
ak_logger.warning(...)lands in theeventfield, keyword arguments become top-level fields, and theloggerfield is set to the mapping's Name — useful for filtering to a specific mapping withgrep '"logger":"<your-mapping-name>"'. -
Interpret the
infodict and act on what's missing:Symptom in infoLikely cause Fix Only subandpicturepresentThe source isn't requesting OpenID Connect scopes, or the IdP isn't granting them On the Authentik source, expand Protocol settings and set Additional Scopes to email profile. For Entra/Azure App Registrations, also confirm under API permissions thatemail,openid,profileare added under Microsoft Graph → Delegated AND show "Granted for \<tenant>" in the Status columnnamepresent,preferred_username/emailmissingThe user account has no UPN/email on the IdP side, or emailpermission isn't admin-consentedEither grant the missing permissions on the IdP, or fall back to deriving the username from namein the mapping (see the Entra tab above)(Entra) Login denied with "authenticate with the source you've previously signed up with"; log shows Refusing to use none property property=emailThe Entra account has no mailbox, so Graph returns mail: null. Because the source matches on email, Authentik refuses rather than create a user with no email. Common on bare*.onmicrosoft.comaccountsFall back to the UPN for email in the mapping: "email": info.get("mail") or info.get("userPrincipalName")(see the Entra tab above). The shipped blueprint andpixee-idpCLI already do this(Entra) Failed to save user/duplicate key value violates unique constraint "authentik_core_user_username_key"A user with that username already exists but with a different (or empty) email, so the matcher can't link to it and tries to enroll a colliding one — usually a leftover from earlier testing Set the existing user's email to match the incoming one so email_linklinks it, or delete the stale user so enrollment recreates it cleanlyAll claims present but mapping still fails Likely a Python error in the expression Look for Failed to execute property mappinglines in the same logRemove the debug line from the mapping expression once the issue is identified — it's noisy at sign-in volume.
Google OAuth
Pixee Enterprise Server supports Google as an identity provider using OAuth 2.0 / OpenID Connect. This works with any Google account (personal Gmail or Google Workspace).
Setup is the same three steps regardless of method: (1) create the OAuth client in Google Cloud → (2) create the source and put it on the login page → (3) grant the admin role. Only step 2 differs by method — the pixee-idp CLI, the Authentik UI, or fully by hand.
Step 1 — Create the OAuth client in Google Cloud (all methods)
- Go to Google Cloud Console and select or create a project
- Go to APIs & Services → Credentials → Create Credentials → OAuth client ID
- If prompted, configure the OAuth consent screen first:
- User Type: Internal (restricts sign-in to your Google Workspace organization) or External (any Google account)
- App name:
Pixee Enterprise Server; Authorized domains: your domain (e.g.getpixee.com)
- Create the OAuth client ID:
- Application type: Web application
- Authorized redirect URI (must be exact, including the trailing slash):
https://<your-domain>/authentik/source/oauth/callback/google/
- Copy the Client ID and Client Secret.
Tip
The CLI prints this exact redirect URI (and the group-sync prerequisites) with pixee-idp emit google-oauth — no credentials needed.
Step 2 — Create the source and add it to the login page
Pick one of the three methods (Choosing a setup method) and follow it end to end. All reach the same result (Google on the login page). Note the Google specifics: the blueprint method still needs the login-page button added by hand, because a blueprint cannot edit the login stage (see the note below). (Group sync and auto-redirect are optional add-ons covered afterward.)
Set up the pixee-idp alias once (see The pixee-idp CLI above), then:
pixee-idp connect google-oauth # enter Client ID; the secret is a hidden prompt (never logged)
connect creates the source, binds the username mapping, and adds it to the login page — the whole step in one command. pixee-idp status google-oauth shows the result (secrets masked). Done — test sign-in.
The chart ships a Pixee - Google Workspace federation blueprint, disabled so its placeholder credentials never auto-apply.
- Customize → Blueprints → on the Pixee - Google Workspace federation row, click the edit (pencil) icon under Actions.
- At the top, toggle Enabled on.
-
Scroll to the bottom and expand Additional settings — the Context field is there. Enter your credentials as a mapping (this exact format):
{google_client_id: "<your client id>", google_client_secret: "<your client secret>", google_source_enabled: true} -
Update to save, then — back on the Blueprints list — click the Apply (▶ play) icon under Actions on that row.
- Add the source to the login page: Flows & Stages → Stages → edit
default-authentication-identification→ add Google Workspace under Sources → Update (see Adding a Source to the Login Page). Then test sign-in.
Save ≠ Apply — click the ▶ Apply action
Saving the instance (even with Enabled on) does not create the source — it can even show status: successful, which is misleading. Only the ▶ Apply icon under Actions on the Blueprints row creates it.
google_source_enabled is required, and is why the seed is safe to ship
The Enabled toggle in step 2 enables the blueprint; google_source_enabled enables the source it creates. Omit it and the blueprint applies cleanly but produces a Google source that is switched off, so the login button does nothing.
It exists because the shipped seed must validate on a cluster with no internet access. Authentik verifies a Google source by fetching accounts.google.com/.well-known/openid-configuration — but only when the source is enabled — and it validates this seed on every install, whether or not you use Google. A seed that shipped enabled would fail that fetch on an air-gapped cluster and, because a blueprint applies atomically, take down all of Pixee sign-in with it. pixee-idp connect google-oauth sets this key for you.
No helper required.
- Directory → Federation and Social login → Create → Google OAuth Source
- Configure (fields not listed can keep their defaults):
- Name:
Google Workspace; Slug:google(must match the redirect URI…/callback/google/) - Consumer Key / Secret: your Client ID / Secret from Step 1
- User matching mode: Link to a user with identical email address (the default won't link returning users by email)
- Group matching mode: default for login only; Link to a group with identical name (
name_link) if you'll enable group sync
- Name:
- Click Create. Google sends no username, so add a username property mapping and select it under the source's User Property Mappings (see Customize Username Derivation), or new users are prompted to pick a username on first sign-in.
- Add the source to the login page: Flows & Stages → Stages → edit
default-authentication-identification→ add Google Workspace under Sources → Update (see Adding a Source to the Login Page). Then test sign-in.
Step 3 — Grant the Pixee admin role
A federated user signs in with no elevated access until you make them an admin. Because Google does not include group membership in its OAuth/OIDC tokens, the name-matching approach doesn't apply — add admins to the pixee-admins group directly in Authentik, or set up group → admin sync below to promote members of a Workspace group automatically. See Granting the Pixee Admin Role for the details.
Google Workspace group to admin sync
Google login authenticates users on its own — this step is only needed if you want members of a Google Workspace group to automatically become Pixee admins. Google does not put group membership in the OIDC token, so Authentik resolves it by calling the Google Directory API at each login with a service-account key.
The service-account key is stored in Authentik's database
The key is held in the blueprint context (readable by any Authentik admin), never a mounted file or Kubernetes Secret — a deliberate self-service tradeoff. If that's unacceptable, manage pixee-admins membership by hand instead. See Notes & limitations.
The Google-side prerequisites (the CLI cannot do these for you — they require Google Cloud and Google Workspace admin access):
- Create a service account and key. In Google Cloud Console, select or create a project and enable the Admin SDK API (APIs & Services → Library → Admin SDK API → Enable). Create a service account (IAM & Admin → Service accounts) — it needs no project IAM roles, since its group-read access comes from the delegation below. Add a JSON key (Keys → Add key → Create new key → JSON) and download it; this is the JSON you supply when applying. Note the service account's numeric client ID (its "Unique ID") — you need it in the next step.
- Grant domain-wide delegation. In the Google Workspace Admin console → Security → Access and data control → API controls → Domain-wide delegation → Manage domain-wide delegation → Add new, enter the service account's client ID and authorize exactly the scope
https://www.googleapis.com/auth/admin.directory.group.readonly. Delegation can take a few minutes to propagate. - Pick the impersonation admin and the admin group. Note a Workspace admin email for the service account to impersonate (the Directory API requires a real admin subject) and the email of the Workspace group whose members should become Pixee admins.
Then enable it. The groups mapping ships already bound to the Google source but inert — with no credentials it returns nothing before it even calls Google, so a plain login never touches it. Supplying the credentials below is all that activates it (no separate "bind the mapping" step for the blueprint/CLI methods).
pixee-idp enable-sync google-oauth # paste the service-account JSON at the prompt (Ctrl-D)
Fills the credentials and activates the (already-bound) mapping — one step.
Customize → Blueprints → Pixee - Google Workspace federation → edit Context, add the three values → Apply. That's it — the mapping is already bound, so nothing else to do.
google_sa_key: '<the service-account JSON, as a string>'
google_delegated_admin: admin@yourcompany.com
google_admin_group: pixee-admins@yourcompany.com
(Pasting the multi-line JSON key into the YAML Context is fiddly — the CLI's enable-sync is easier for the key.)
If you created the source by hand (no blueprint), build the mapping yourself: Customization → Property Mappings → Create → OAuth Source Property Mapping, name it Pixee Google Workspace Groups, and use a Directory-API expression with your service-account JSON, delegated-admin email, and admin-group email inlined (use the shipped blueprint's mapping as the template). Then add it under the Google Workspace source's User Property Mappings and Update.
Rotating the key is a re-run, not a redeploy. Group lookup fails open: if the Directory API is unreachable or misconfigured, login still succeeds (the user just gets no admin role).
Notes & limitations
- The login-page button and auto-redirect are stage edits, not blueprint steps. Authentik's blueprint apply merges the identification stage's
user_fields(it can add a source but never clear it), so auto-redirect can't be a blueprint and a blueprint that setsuser_fieldsleaves a harmless duplicate (Authentik dedupes at render). Do these via the CLI (pixee-idp auto-redirect) or the UI stage editor — both replace cleanly. - In the UI, save ≠ apply. Editing/saving a blueprint instance doesn't run it (it may even show status: successful); click the ▶ Apply action on the Blueprints row.
- Group sync stores the service-account key in Authentik's database (blueprint context, readable by any Authentik admin) — never a file or Kubernetes Secret. Manage
pixee-adminsby hand if that's unacceptable. - The Directory-API mapping is Google-specific. Other IdPs (Entra, Okta, Oracle) can put groups in the token, so they use
name_linkand need no Directory-API mapping. Oracle still needs a mapping of its own, but only to normalize the shape of the groups it sends — see Oracle group to admin sync.
Okta (OAuth)
Pixee Enterprise Server supports Okta as a federated identity provider through Authentik using OAuth 2.0 / OpenID Connect. Unlike Google, Okta puts group membership in the token, so promoting an Okta group to Pixee admin is automatic (name_link), with no service account and no separate sync command. See Okta group to admin sync for the one Okta-side requirement.
Setup is the same three steps regardless of method: (1) create the OIDC app in Okta, (2) create the source and put it on the login page, (3) grant the admin role. Only step 2 differs by method: the pixee-idp CLI, the Authentik UI, or fully by hand.
Step 1 — Create the OIDC app in Okta (all methods)
Create a Web Application (OIDC) app integration in the Okta Admin Console following Okta's guide for creating OpenID Connect app integrations. Only these values are Pixee-specific:
- Sign-in redirect URI (exact, including the trailing slash):
https://<your-domain>/authentik/source/oauth/callback/okta/ - Assignments: assign the users/groups who should be able to sign in
- Afterward, capture the Client ID, Client secret, and your Okta org URL (e.g.
https://mycompany.okta.com) for Step 2
Use the org URL, not the -admin console URL
Authentik needs your org domain, mycompany.okta.com. The admin console host mycompany-admin.okta.com does not serve the OAuth endpoints and will return 404 at sign-in. (The CLI strips -admin automatically; set it correctly yourself in the UI/blueprint path.)
Tip
pixee-idp emit okta prints the exact redirect URI and the group-sync prerequisites, with no credentials needed.
Step 2 — Create the source and add it to the login page
Pick one of the three methods (Choosing a setup method). All reach the same result (Okta on the login page):
Set up the pixee-idp alias once (see The pixee-idp CLI above), then:
pixee-idp connect okta # prompts: Client ID, Client secret (hidden), Okta org URL
connect creates the source (deriving the OIDC endpoints from the org URL), binds the username and groups mappings, and adds it to the login page, the whole step in one command. pixee-idp status okta shows the result (secret masked). Done. Test sign-in.
The chart ships a Pixee - Okta federation blueprint, disabled so its placeholder credentials never auto-apply. In Customize → Blueprints, edit its Context with your okta_client_id, okta_client_secret, okta_source_enabled: true, and the okta_authorization_url / okta_token_url / okta_profile_url endpoints (see Authentik's Okta docs for the exact URL patterns), toggle Enabled on, and click the ▶ Apply action. Then add the source to the login page (Flows & Stages → Stages → edit default-authentication-identification → add Okta under Sources → Update; see Adding a Source to the Login Page).
okta_source_enabled is required, and is why the seed is safe to ship
The Enabled toggle enables the blueprint; okta_source_enabled enables the source it creates. Omit it and the blueprint applies cleanly but produces an Okta source that is switched off, so the login button does nothing.
It exists so the shipped seed can never make a network call while it still holds placeholders. Authentik fetches a source's discovery document when it validates one — but only when the source is enabled — and it validates this seed on every install, whether or not you use Okta. Because a blueprint applies atomically, a fetch that could not complete would take down all of Pixee sign-in with it. This seed also omits the discovery URLs, so today there is nothing to fetch; the flag keeps that true if the Okta source type ever gains a default one. pixee-idp connect okta sets this key for you.
Create the source by hand following Authentik's Okta OAuth source guide: slug okta, your Client ID/secret as Consumer key/secret, and the authorize / token / userinfo endpoints for your org. Then add it to the login page.
Step 3 — Grant the Pixee admin role
Add admins to the pixee-admins group directly in Authentik, or set up Okta group → admin sync below to promote members of an Okta group automatically. See Granting the Pixee Admin Role for the details.
Okta group to admin sync
Name an Okta group pixee-admins, put your admins in it, and Authentik links it to the Pixee admin role automatically at each login, provided the group name reaches Authentik. Authentik reads claims from the userinfo endpoint, and getting Okta groups there has one firm requirement:
- Use a custom authorization server. Okta's org authorization server returns groups from
/userinfoonly when thegroupsscope is requested, and Authentik's Okta client requests exactlyopenid email profile— nevergroups— so on the org server the claim never arrives. A custom server's claims default to Any scope, which is why it works without one being requested. Point the source at your custom (usuallydefault) server: passhttps://<org>.okta.com/oauth2/defaulttoconnect(or set the…/oauth2/default/v1/…endpoints in the UI). Adding agroupsscope on the Okta side does not help — nothing asks for it. - Add a
groupsclaim, and allow your app. On that custom server, following Okta's own guides:- Customize tokens with a groups claim: add a
groupsclaim with Include in token type: ID Token (userinfo mirrors ID-token claims, not access-token), Value type: Groups, filter Matches regex.*. - Create access policies and rules: the custom server needs an access policy assigned to your app with a rule permitting the Authorization Code grant (without a rule, Okta returns
access_denied/ "Policy evaluation failed").
- Customize tokens with a groups claim: add a
Group sync fails open: if groups don't arrive, login still succeeds; the user just receives no admin role (grant pixee-admins by hand in Authentik).
Hand-granting stops working once sync has run
Authentik removes only the groups this source linked (groupsourceconnection__source), which is what protects hand-granted admins before sync is ever configured. But that source link is permanent: once Okta has synced pixee-admins even once, a later login whose claim is missing strips the group again — and re-granting by hand will not survive the login after that. If sync breaks, repair the claim rather than re-granting.
Auth-only is simpler
If you don't need automatic group→admin promotion, skip the custom server entirely: the org authorization server (https://<org>.okta.com) is enough for login, and you assign pixee-admins by hand.
Microsoft Entra ID (OAuth)
Pixee Enterprise Server supports Microsoft Entra ID (formerly Azure AD) as a federated identity provider through Authentik using OAuth 2.0 / OpenID Connect. Authentik's Entra type fetches group membership from Microsoft Graph natively, using the signed-in user's own token (no service account), so group to admin sync is an opt-in scope with no service account and no property mapping.
Pick one of the three methods (Choosing a setup method). All reach the same result (Entra ID on the login page).
Step 1: Create the Entra app registration (all methods)
Create an app registration following Authentik's Entra ID OAuth guide. Only these values are Pixee-specific:
- Redirect URI (exact, including the trailing slash):
https://<your-domain>/authentik/source/oauth/callback/entra/ - Capture the Application (client) ID and a client secret Value.
- For a single-tenant app, note the Directory (tenant) ID. Multi-tenant apps use the default
/common/endpoints.
Tip
pixee-idp emit entra prints the exact redirect URI and the group-sync prerequisites, with no credentials needed.
Step 2: Create the source and add it to the login page
Set up the pixee-idp alias once (see The pixee-idp CLI above), then:
pixee-idp connect entra # prompts: Client ID, Client secret (hidden), tenant ID
connect creates the source and adds it to the login page. It prompts for the tenant ID: single-tenant apps require it (leaving it blank uses the multi-tenant /common/ endpoint, which single-tenant apps reject with AADSTS50194); multi-tenant apps can leave it blank. --tenant-id <id> overrides the prompt for non-interactive use. pixee-idp status entra shows the result (secret masked). Done. Test sign-in.
The chart ships a Pixee - Entra ID federation blueprint, disabled so its placeholder credentials never auto-apply. In Customize → Blueprints, edit its Context with your entra_client_id, entra_client_secret and entra_source_enabled: true (and, to pin a single tenant, put your tenant ID in place of common in entra_authorization_url / entra_token_url), toggle Enabled on, and click the ▶ Apply action. Then add Microsoft Entra ID to the login page (see Adding a Source to the Login Page).
entra_source_enabled is required, and is why the seed is safe to ship
The Enabled toggle enables the blueprint; entra_source_enabled enables the source it creates. Omit it and the blueprint applies cleanly but produces an Entra source that is switched off, so the login button does nothing.
It exists because the shipped seed must validate on a cluster with no internet access. Authentik verifies an Entra source by fetching login.microsoftonline.com — but only when the source is enabled — and it validates this seed on every install, whether or not you use Entra. A seed that shipped enabled would fail that fetch on an air-gapped cluster and, because a blueprint applies atomically, take down all of Pixee sign-in with it. pixee-idp connect entra sets this key for you.
Create the source by hand following Authentik's Entra ID OAuth guide: slug entra, your Application (client) ID and client secret Value. Then add it to the login page. Authentik derives the username from userPrincipalName; to customize it see Optional: Customize Username Derivation.
Step 3: Grant the Pixee admin role
Add admins to the pixee-admins group directly in Authentik, or set up Entra group to admin sync below to promote members of an Entra group automatically. See Granting the Pixee Admin Role for the details.
Entra group to admin sync
Name an Entra group pixee-admins, add your admins to it, and Authentik promotes its members to Pixee admin. Authentik's Entra type fetches the user's group membership from Microsoft Graph using their own token (no service account), then matches by group name. Group sync is opt-in, because it needs one Graph permission with admin consent:
- On the app registration, add the delegated Microsoft Graph permission
GroupMember.Read.Alland grant admin consent for it (see Microsoft: Grant tenant-wide admin consent; this permission is also covered under "Group Member" in Authentik's Entra guide). - In Entra → Groups → New group, create a Security group (Group type: Security) named exactly
pixee-adminsand add your admins as members. Leave "Microsoft Entra roles can be assigned to the group" set to No — that toggle is for assigning Entra directory roles to the group and is unrelated to the Pixee admin role, which is granted purely by group name matching (name_link). If apixee-adminsgroup already exists, reuse it. (Authentik matches on the group's display name, so the group's type does not otherwise matter, but a plain security group is the right choice.) - Turn it on:
pixee-idp enable-sync entra(or setentra_additional_scopestohttps://graph.microsoft.com/GroupMember.Read.Allin the blueprint Context and Apply).
Grant admin consent BEFORE enabling
If the GroupMember.Read.All scope is requested but admin consent has not been granted, Entra's Graph call fails and Authentik aborts the login. Grant admin consent first. If login breaks, turn the scope back off with pixee-idp enable-sync entra --disable (or clear entra_additional_scopes and Apply). With the scope off (the default), authentication always works.
Once consent is in place, group sync fails open with respect to group membership: a user who is in no matching group still signs in, just without the admin role (grant pixee-admins by hand in Authentik).
It does not fail open on Graph availability. While the scope is on, every Entra login makes a delegated Graph call for the user's groups, and Authentik treats a failed call as an unusable profile and aborts the login. So a Graph outage, a throttled tenant, or admin consent revoked later blocks sign-in for all Entra users, not just their admin role. The fast way out is pixee-idp enable-sync entra --disable, which removes the scope and takes Graph off the login path (authentication works again immediately; grant the admin role by hand until sync is re-enabled).
Large directories: provision over SCIM instead
Because the Graph lookup happens on every login, Authentik recommends Entra ID SCIM provisioning for organizations with many users and groups. Entra pushes users and groups into Authentik ahead of time, which removes both the per-login delay and the login-path dependency on Graph described above. Group-to-admin matching still works by name, so a pixee-admins group provisioned over SCIM grants the Pixee admin role the same way.
Google Workspace (SAML)
Pixee Enterprise Server supports Google Workspace as an external identity provider using SAML.
Step 1: Create a SAML App in Google Workspace
- Go to Google Admin Console (
admin.google.com) → Apps → Web and mobile apps → Add app → Add custom SAML app - Enter a name (e.g.,
Pixee Enterprise Server) and click Continue - Copy the SSO URL and Certificate from Google — you will need these for the Authentik source configuration
-
Under Service Provider Details, set:
- ACS URL:
https://<your-domain>/authentik/source/saml/google/acs/ - Entity ID:
https://<your-domain>/authentik/source/saml/google/metadata - Name ID format:
EMAIL - Name ID:
Basic Information > Primary email
- ACS URL:
-
Check the Signed response checkbox
- Click Continue, then Finish
Enable the app for users
By default, new SAML apps in Google Workspace are OFF for everyone. You must turn it on:
- Click on the newly created app
- Click User access
- Set the service status to ON for everyone (or for the appropriate organizational units)
- Click Save
Step 2: Create a SAML Source in Authentik
Follow the Authentik documentation for Google Workspace SAML integration to create a SAML source using the SSO URL and Certificate from Step 1.
- In the Authentik admin interface, go to Directory → Federation and Social login → Create → SAML Source
- Set the Name (e.g.,
Google Workspace) and Slug (e.g.,google) - Set the Icon field to
/static/authentik/sources/google.svgso the Google logo appears on the login page - Set the SSO URL to the value copied from Google (e.g.,
https://accounts.google.com/o/saml2/idp?idpid=<your-idp-id>) - Set the Binding Type to Redirect (required for auto-redirect to work)
- Upload the Signing Certificate downloaded from Google
After creating the source, add it to the login page.
Troubleshooting
403 app_not_configured_for_user: This means either the Entity ID doesn't match or the app isn't enabled for the user. Verify that the Entity ID in Google Admin Console exactly matches the Authentik metadata URL (case-sensitive), and that the app is turned ON for the user's organizational unit.No Signature exists in the Response element: Enable the Signed response checkbox in the Google Admin Console SAML app under Service Provider Details.- "Permission denied" on login: Verify the Pixee application in Authentik is linked to the
pixeeprovider. Check Applications > Pixee Enterprise Server > Provider assignment.
Oracle Identity Domains (OAuth)
Pixee Enterprise Server supports Oracle Identity Domains as a federated identity provider through Authentik using OAuth 2.0 / OpenID Connect. Oracle has no dedicated Authentik source type, so it uses the generic OpenID Connect type with all three endpoint URLs set explicitly. Group to admin sync is an opt-in scope: Oracle returns group membership only when the groups scope is requested. See Oracle group to admin sync.
Setup is the same three steps regardless of method: (1) create the confidential application in Oracle, (2) create the source and put it on the login page, (3) grant the admin role. Only step 2 differs by method: the pixee-idp CLI, the Authentik UI, or fully by hand.
Step 1 — Create the confidential application in Oracle (all methods)
- Go to OCI Console → Identity & Security → Domains and select your domain
- Navigate to Integrated applications → Add application → Confidential Application
- Enter a name (e.g.
Pixee Enterprise Server) and click Next - Under Client configuration, check "Configure this application as a client now"
- Set Allowed Grant Types to Authorization Code
-
Set Redirect URL to (exact, including the trailing slash):
https://<your-domain>/authentik/source/oauth/callback/oracle/ -
Leave Token issuance policy set to All
- Click Finish, then Activate the application
- Copy the Client ID and Client Secret, and note your Domain URL (under Domain information, e.g.
https://idcs-<guid>.identity.oraclecloud.com). The OIDC endpoints are derived from it.
Warning
Do not register Authentik as a Social Identity Provider in Oracle. Oracle should handle password authentication directly.
Tip
pixee-idp emit oracle prints the exact redirect URL and the group-sync prerequisites, with no credentials needed.
Step 2 — Create the source and add it to the login page
Pick one of the three methods (Choosing a setup method). All reach the same result (Oracle on the login page):
Set up the pixee-idp alias once (see The pixee-idp CLI above), then:
pixee-idp connect oracle # prompts: Client ID, Client secret (hidden), domain URL
connect creates the source (deriving the three OIDC endpoints from the domain URL), binds the username and groups mappings, and adds it to the login page, the whole step in one command. pixee-idp status oracle shows the result (secret masked). Done. Test sign-in.
The chart ships a Pixee - Oracle Identity Domains federation blueprint, disabled so its placeholder credentials never auto-apply. In Customize → Blueprints, edit its Context with your oracle_client_id, oracle_client_secret, oracle_source_enabled: true, and the oracle_authorization_url / oracle_token_url / oracle_profile_url endpoints (the patterns are in the manual tab below), toggle Enabled on, and click the ▶ Apply action. Then add the source to the login page (Flows & Stages → Stages → edit default-authentication-identification → add Oracle Identity Domains under Sources → Update; see Adding a Source to the Login Page).
oracle_source_enabled is required, and is why the seed is safe to ship
The Enabled toggle enables the blueprint; oracle_source_enabled enables the source it creates. Omit it and the blueprint applies cleanly but produces an Oracle source that is switched off, so the login button does nothing.
It exists so the shipped seed can never make a network call while it still holds placeholders. Authentik fetches a source's discovery document when it validates one — but only when the source is enabled — and it validates this seed on every install, whether or not you use Oracle. Because a blueprint applies atomically, a fetch that could not complete would take down all of Pixee sign-in with it. This seed also omits the discovery URLs, so today there is nothing to fetch; the flag keeps that true if the generic OpenID Connect source type ever gains a default one. pixee-idp connect oracle sets this key for you.
This method sets up authentication, which works exactly as it does via the other two methods. Group → admin sync needs one extra step here: Oracle returns group membership as objects rather than names, so a hand-created source also needs the normalizing property mapping the blueprint ships. Enabling sync without it breaks sign-in for anyone in an Oracle group — see the warning in that section for how to add it by hand.
Create the source by hand following Authentik's OAuth source guide using the OpenID Connect type, with slug oracle (it must match the redirect URL …/callback/oracle/) and your Client ID / Secret as the Consumer key / secret. Set User matching mode to Link to a user with identical email address. Your Oracle endpoint URLs follow this pattern (replace <your-idcs-instance> with your domain identifier):
- Authorization URL:
https://<your-idcs-instance>.identity.oraclecloud.com/oauth2/v1/authorize - Access token URL:
https://<your-idcs-instance>.identity.oraclecloud.com/oauth2/v1/token - Profile URL:
https://<your-idcs-instance>.identity.oraclecloud.com/oauth2/v1/userinfo
You can confirm them in your domain's discovery document at https://<your-idcs-instance>.identity.oraclecloud.com/.well-known/openid-configuration. Then add the source to the login page.
Note
All three endpoint URLs must be set explicitly. Do not rely solely on the OIDC Well-known URL to auto-populate them, or sign-in redirects loop back to Authentik.
Step 3 — Grant the Pixee admin role
Add admins to the pixee-admins group directly in Authentik, or set up Oracle group → admin sync below to promote members of an Oracle group automatically. See Granting the Pixee Admin Role for the details.
Oracle group to admin sync
Name an Oracle group pixee-admins, add your admins to it, and Authentik promotes its members to Pixee admin by matching the group name (name_link). Group sync is opt-in, because it depends on one extra OAuth scope:
Authentik reads a generic OIDC source's claims from the userinfo endpoint, and Oracle returns group membership there only when the groups scope is requested. Oracle documents the scope set for browser login flows as openid approles groups, whose access token "can be used with /oauth2/v1/userinfo to get the user's roles and groups". Requesting that scope set is therefore what turns sync on. Pixee only reads groups; approles is inert.
- In your identity domain, create a group named exactly
pixee-adminsand add your admins as members. If one already exists, reuse it. -
Confirm your identity domain offers the scope — it is available by default on a confidential application with no custom scopes defined, and Oracle documents no setting that grants it:
curl -s https://<your-idcs-instance>.identity.oraclecloud.com/.well-known/openid-configuration | jq '.scopes_supported'Look for
groupsin the list. If it is absent, stop here — enabling sync would block sign-in (see the warning below). -
Turn it on:
pixee-idp enable-sync oracle(or setoracle_additional_scopestoapproles groupsin the blueprint Context and Apply).
A rejected scope blocks sign-in for everyone
The scope is sent to /oauth2/v1/authorize, so if your domain does not allow it, Oracle rejects the request with invalid_scope and no one can sign in. Turn it back off with pixee-idp enable-sync oracle --disable (or clear oracle_additional_scopes and Apply). With the scope off (the default), authentication always works. Pixee reads only groups; approles rides along because it is the scope set Oracle documents for browser login flows.
Once the scope is in place, group sync fails open: a user who is in no matching group still signs in, just without the admin role (grant pixee-admins by hand in Authentik).
Hand-granting stops working once sync has run
Authentik removes only the groups this source linked (groupsourceconnection__source), which is what protects hand-granted admins before sync is ever configured. But that source link is permanent: once Oracle has synced pixee-admins even once, a later login without the group claim strips the group again, and re-granting by hand will not survive the login after that. If sync breaks, restore the claim rather than re-granting.
Custom Claims cannot be used for this
Oracle's Custom Claims API adds claims to the access token or identity token (tokenType is AT, IT, or BOTH), never to the userinfo response. Because Authentik reads claims from userinfo, a custom groups claim never reaches it. Use the scope above instead.
Group sync requires the source created by the CLI or the blueprint
Oracle returns groups as a list of objects keyed id, name and $ref — for example {"id": "0db0…", "name": "pixee-admins", "$ref": "https://…/Groups/0db0…"} — rather than as plain group names, and Authentik cannot consume that form on its own. The blueprint ships a property mapping that normalizes it, and pixee-idp connect oracle binds that mapping for you.
A source you created by hand has no such mapping, so enabling group sync on it makes sign-in fail with a server error on the callback for every user who belongs to at least one Oracle group. Users who belong to no group are unaffected, which can make the problem look intermittent.
If you created the source by hand and want group sync, two things must be in place before you enable the scope:
- Set the source's Group matching mode to Link to a group with identical name (
name_link). The default matches on identifier instead, which makes Authentik try to create a group namedpixee-admins; because that group already exists, the sign-in fails. The CLI and blueprint set this for you. - Build the mapping: Customization → Property Mappings → Create → OAuth Source Property Mapping, name it
Pixee Oracle Groups, and copy the expression verbatim from the shipped Pixee - Oracle Identity Domains federation blueprint (Customize → Blueprints). Then add it under the Oracle source's User Property Mappings and Update. Copy the expression as-is rather than writing your own — the way it returns its result is deliberate and load-bearing, and is explained in the blueprint's comments.
Troubleshooting
- "Permission denied" on login: Verify the Pixee application in Authentik is linked to the
pixeeprovider. Check Applications → Pixee Enterprise Server → Provider assignment. - Redirect loop on Oracle login: Ensure the Authorization, Token, and Profile URLs are all explicitly set on the Oracle source. If any are blank, the redirect loops back to Authentik.
- Oracle shows Authentik login button: Remove any Social Identity Provider entries for Authentik from Oracle under Security → Identity providers.
invalid_scopeat Oracle after enabling group sync: your domain does not offer the scope to this application. Confirm withcurl -s https://<your-idcs-instance>.identity.oraclecloud.com/.well-known/openid-configuration | jq '.scopes_supported'; ifgroupsis absent, turn sync back off withpixee-idp enable-sync oracle --disableand grant the admin role in Authentik instead. Ifgroupsis offered butapprolesis not, narrow the request instead of abandoning sync: setoracle_additional_scopesto justgroupsin the blueprint Context and Apply. Pixee reads onlygroups, so a narrowed field is a fully working install —pixee-idp status oraclestill reports group sync ON, andenable-sync oracleleaves it alone rather than restoring the pair your domain rejects. Sign-in is blocked for everyone until you do one or the other.- Sign-in works but no one becomes an admin: group sync is probably off (the default).
pixee-idp status oraclereportsadditional_scopesand whether group sync is on. Also check that the Oracle group is named exactlypixee-adminsand thatgroup_matching_modeisname_link. - Server error on the callback after enabling group sync: the source is missing the groups property mapping, or its Group matching mode is not
name_link. This affects only users who belong to at least one Oracle group, so it can look intermittent. Sources created bypixee-idp connect oracleor by the blueprint have both; a hand-created source needs them added (see Oracle group to admin sync).
LDAP
Pixee Enterprise Server supports LDAP directories as an authentication source through Authentik's LDAP federation. Users authenticate with their existing LDAP credentials — Authentik verifies passwords directly against the LDAP server and syncs user accounts automatically.
Prerequisites
Gather the following from your LDAP administrator:
- Server URL:
ldap://ldap.example.comorldaps://ldap.example.com(LDAPS recommended for production) - Bind DN: A service account DN for searching the directory (e.g.,
cn=svc-pixee,ou=service-accounts,dc=example,dc=com) - Bind Password: Password for the service account
- Base DN: Where to search for users (e.g.,
dc=example,dc=com) - User Object Filter: LDAP filter for user objects (e.g.,
(objectClass=person)) - Group Object Filter: LDAP filter for group objects (e.g.,
(objectClass=groupOfUniqueNames))
Network Access
The Pixee Enterprise Server cluster must be able to reach the LDAP server. The default ports are 389 (LDAP) and 636 (LDAPS), but non-standard ports are supported via the Server URI (e.g., ldap://ldap.example.com:3389). Verify network connectivity and firewall rules before configuring.
Step 1: Create an LDAP Source in Authentik
- In the Authentik admin interface, go to Directory → Federation and Social login → Create → LDAP Source
-
Configure the connection settings:
- Name: A descriptive name (e.g.,
Corporate LDAP) - Slug:
ldap(or a descriptive slug likecorporate-ldap) - Server URI: Your LDAP server URL (e.g.,
ldaps://ldap.example.com) - Bind CN: The service account DN
- Bind Password: The service account password
- Base DN: The search base for your directory (e.g.,
dc=example,dc=com)
- Name: A descriptive name (e.g.,
-
Configure the search settings:
- User Property Mappings: Select all the default LDAP property mappings (these map LDAP attributes to Authentik user fields)
- Group Property Mappings: Select the default LDAP group property mappings
- User object filter: LDAP filter for user objects (e.g.,
(objectClass=person)) — adjust for your directory - Group object filter: LDAP filter for group objects (e.g.,
(objectClass=groupOfUniqueNames)) — adjust for your directory - Group membership field:
member(oruniqueMemberdepending on your directory schema) - Object uniqueness field:
uid(adjust for your directory)
-
Under password settings, ensure the following are disabled:
- Update internal password on login: When enabled, Authentik stores a copy of the user's LDAP password internally. Disable this so that passwords are always verified directly against the LDAP server.
- User password writeback: When enabled, password changes in Authentik are written back to the LDAP server. Disable this unless you want users to change their LDAP password through Authentik.
-
Click Create
Step 2: Verify User Sync
After creating the LDAP source, trigger a sync and verify:
- Go to Directory → Federation and Social login, click on your LDAP source, and click Run sync
- Go to Directory → Users and verify that LDAP users have been imported
- Go to Directory → Groups and verify that LDAP groups have been imported
If users are not appearing after sync, check the sync logs:
- In the Authentik admin interface, go to Events → Logs
- Look for entries with action
configuration_error— these indicate sync failures with details about what went wrong -
Alternatively, check the Authentik worker pod logs directly:
kubectl logs -n <namespace> deploy/<release-name>-authentik-worker --tail=200 | grep -i "ldap\|configuration_error\|username"Common errors in the logs include:
- "Username was not set by propertymappings": Ensure a property mapping that sets the
usernamefield is selected on the LDAP source under User Property Mappings - "Could not find page in cache": The sync pagination timed out — try running the sync again, or increase the
ldap.task_timeout_hourssetting - "LDAPServerPoolExhaustedError": Authentik cannot connect to the LDAP server — check network connectivity and TLS settings
- "Username was not set by propertymappings": Ensure a property mapping that sets the
Sync Schedule
By default, Authentik syncs LDAP users and groups periodically (every 120 minutes). You can trigger a manual sync at any time from the LDAP source configuration page. Adjust the sync frequency in the LDAP source's Advanced settings if needed.
Step 3: Add LDAP to the Login Page
After creating the source, add it to the login page.
Once added, users will see an LDAP login option. When a user enters their LDAP credentials, Authentik authenticates them directly against the LDAP server.
How LDAP Authentication Works
When users log in via the LDAP source, Authentik performs a bind operation against the LDAP server using the user's credentials. With the recommended password settings above (both disabled), passwords are not stored in Authentik and are always verified directly against the LDAP server. If a user changes their LDAP password, the change takes effect immediately.
Troubleshooting
- "Connection refused" or timeout: Verify network connectivity from the cluster to the LDAP server. Check that the correct port (389 for LDAP, 636 for LDAPS) is open.
- "Invalid credentials" on bind: Verify the Bind DN and password.
- "Username was not set by propertymappings": Ensure a property mapping that sets the
usernamefield is selected on the LDAP source under User Property Mappings. - No users synced: Check the Base DN and user object filter. Use
ldapsearchto verify the filter returns results from outside the cluster. - Users synced but cannot log in: Ensure the LDAP source is added to the login page identification stage (see Adding a Source to the Login Page).
- "Permission denied" after LDAP login: Verify the Pixee application in Authentik is linked to the
pixeeprovider. Check Applications > Pixee Enterprise Server > Provider assignment. - TLS/certificate errors with LDAPS: If using a self-signed or internal CA certificate, you may need to add the CA certificate to the Authentik server's trust store.
Enable "Forgot Password?" Link on the Login Page
By default, the Authentik sign-in form does not show a "Forgot password?" link. Administrators can always trigger a password reset for any user from the Authentik admin console (Directory → Users → \<user> → Copy recovery link / Send recovery link via email) without any additional configuration — that path works out of the box.
To let end users self-service password recovery directly from the sign-in form, link the bundled pixee-recovery-flow to the identification stage:
- In the Authentik admin interface, go to Flows and Stages → Stages
- Edit default-authentication-identification
- Under Flow settings, set Recovery flow to Password Recovery (
pixee-recovery-flow) - Click Update to save
The "Forgot password?" link will now appear on the sign-in form. Clicking it walks the user through email-based password recovery.
SMTP required for email recovery
Self-service password recovery delivers a one-time-use reset link by email. Configure SMTP in the admin console (Config → SMTP / Email Settings) before enabling this link — otherwise users who click "Forgot password?" will hit a stage that cannot send mail. Administrator-triggered recovery via the admin console works regardless, but only the Send recovery link via email button needs SMTP; Copy recovery link always works.
Federated users
If users sign in through an external identity provider (Entra, Okta, etc.), they reset their password at the upstream provider — Authentik's password recovery only applies to local Authentik accounts (e.g. akadmin, breakglass accounts). For federated-only installs you can skip this step.
Auto-Redirect to Identity Provider
By default, when a federated identity provider is added as a source, users see the Authentik login page with both username/password fields and the identity provider button. To skip this page and redirect users directly to the identity provider, clear the identification stage's user fields (with no user fields and exactly one source, Authentik redirects automatically).
Auto-redirect cannot be a blueprint
This step must be done with the CLI or the UI stage editor — not a downloadable/shipped blueprint. Authentik's blueprint apply merges the stage's user_fields, so a blueprint can never clear them; only a direct edit (which both the CLI and the UI stage editor perform) can.
pixee-idp auto-redirect            # enable — clears the form, redirects to the sole source
pixee-idp auto-redirect disable    # revert — restores the username form (source stays a button)
It guards first (exactly one source, the local-admin escape-hatch flow exists, no passwordless flow), then clears user_fields and binds the source.
- Flows and Stages → Stages → edit default-authentication-identification
- Under User fields, deselect all (remove Username, Email, etc.)
- Under Sources, ensure only the identity provider source is selected
- Ensure Passwordless flow is not set — auto-redirect only works when this is empty
- Click Update
Bookmark the local-admin escape hatch first
Once auto-redirect is on, the normal login page goes straight to the IdP, so local accounts (e.g. akadmin) can no longer use it. They sign in at the chart-provisioned direct-login flow instead: https://<your-domain>/authentik/if/flow/direct-authentication-flow/. Bookmark it before enabling.
SAML Binding Type
For SAML sources, ensure the Binding Type on the source is set to Redirect rather than POST. With Redirect binding, Authentik performs a direct HTTP 302 to the identity provider. POST binding requires an intermediate page to submit the SAML request form.
Multiple Identity Providers
If more than one source is configured on the identification stage, auto-redirect is disabled and users will see a source selection page instead.
Direct Login for Administrators
When auto-redirect is enabled, administrators who need to log in with username/password (e.g., the akadmin account) can no longer use the default login page. The chart automatically provisions a dedicated direct-login flow for this purpose, so no manual setup is required.
Administrators can log in directly at:
https://<your-domain>/authentik/if/flow/direct-authentication-flow/
The admin console shows this link for your deployment under Config → Authentication, next to the default admin credentials.
This flow presents a username/password form with no identity provider sources, so it bypasses the auto-redirect configured on the default flow. It reuses the built-in MFA validation and login stages.
Recovering Access When You Cannot Sign In
Every login goes through Authentik, so pick the tab matching what you are seeing. In the commands below, <release-name> is pixee-enterprise-server on an embedded cluster and <namespace> is kotsadm.
Symptom: the login page redirects straight to your identity provider, and you need a local account instead. Common when your IdP is down, or when your own account there cannot get in.
Authentik is healthy here; only the login page is sending you upstream. Sign in at the direct login flow, which presents a username/password form with no identity provider sources:
https://<your-domain>/authentik/if/flow/direct-authentication-flow/
Symptom: you can reach an Authentik login form but no password you have works.
Generate a one-time recovery link for akadmin, valid for 30 minutes. This works from outside the browser and needs no SMTP, so it is also the answer when password reset email is not configured:
kubectl exec -n <namespace> deploy/<release-name>-authentik-server -- \
  ak create_recovery_key 30 akadmin
Open the printed URL to set a new password.
Symptom: the login page errors, hangs, or never loads. Usually the server cannot reach its PostgreSQL database or its Valkey cache.
Every other recovery route goes through Authentik, so confirm this is what you are looking at first:
kubectl get pods -n <namespace> -l app.kubernetes.io/name=authentik
kubectl exec -n <namespace> deploy/<release-name>-platform -- \
  curl -sS -o /dev/null -w '%{http_code}\n' \
  http://<release-name>-authentik-server/authentik/-/health/ready/
A readiness response of 204 means Authentik is fine and your problem is one of the other tabs. Anything else, or no response at all, means it cannot serve logins.
The Authentik server logs usually name the cause. A support bundle runs this same check as "Verify Authentik is ready to serve logins" and collects those logs alongside it:
kubectl logs -n <namespace> deploy/<release-name>-authentik-server --tail=100
If the database is the problem, the bundle's database analyzer and the CloudNativePG cluster status are the next place to look. Repair Authentik and logins resume with no further action. If you need access to Pixee before you can repair it, see the Break glass tab.
Use only when Authentik cannot be repaired quickly and you need access now. Every option in the other tabs requires a working Authentik, so this is the one route that does not.
Start the platform with authentication turned off:
kubectl set env -n <namespace> deploy/<release-name>-platform \
  PIXEE_AUTHENTICATION_ENABLED=false PIXEE_ACCESS_ENABLED=false
The platform restarts and serves without a login. Authentik keeps running untouched, so you can carry on repairing it.
This removes all authentication
While those variables are set, anyone who can reach the deployment has full access and requests are attributable to nobody. Treat it as an outage measure on a trusted network, restore authentication as soon as Authentik is healthy, and review the platform audit trail afterwards for anything that happened during the window.
Restore authentication by removing the override:
kubectl set env -n <namespace> deploy/<release-name>-platform \
  PIXEE_AUTHENTICATION_ENABLED- PIXEE_ACCESS_ENABLED-
Deploying again from the admin console also restores it, because the Deployment is re-rendered from your saved configuration. That is deliberate: the override cannot outlive the next deploy, so a deployment cannot be left permanently unauthenticated by forgetting to undo this. It also means an upgrade landing while you are still repairing Authentik will re-enable authentication and lock you out again, so finish the repair before deploying.
Development Platform Integrations
This section covers integrating Pixee Enterprise Server with various development platforms and source code management systems.
Azure DevOps Integration
Azure DevOps integration allows Pixee Enterprise Server to work with your Azure DevOps repositories. Pixee can authenticate using either a personal access token (the default) or a Microsoft Entra service principal.
Authentication methods
Choose one authentication method at install or configuration time:
- Personal Access Token (PAT) (default): Pixee authenticates with a personal access token over HTTP Basic auth. Works against both Azure DevOps Services and on-prem Azure DevOps Server.
- Entra Service Principal (SPN): Pixee authenticates with a Microsoft Entra service principal using the OAuth 2.0 client-credentials flow, sending the resulting bearer token on both REST and Git operations. Use this when your organization has standardized on Entra and disallows personal access tokens.
Warning
Service-principal authentication is supported only against Azure DevOps Services (dev.azure.com). On-prem Azure DevOps Server must use a personal access token.
Requirements
For PAT authentication:
- Your Azure DevOps organization name
-
A personal access token with a custom scope (not "Full access", which grants broader permissions than necessary) that includes:
- Code (Read & Write) — read repositories, push fix branches, and open and update pull requests
- Build (Read) — read builds and download build artifacts
- Work Items (Read & Write) — required only when a work item ID is configured
For SPN authentication:
- Your Azure DevOps organization name
- A Microsoft Entra app registration (service principal) in your tenant. From the registration you need the tenant (directory) ID, the application (client) ID, and a client secret.
- The service principal must be added to your Azure DevOps organization as a user and granted Code (Read & Write) access on the repositories Pixee operates on. It also needs Work Items (Read & Write) when a work item ID is configured.
Info
The webhook user and password are optional properties for Azure DevOps webhook authentication. If configured, these credentials will be used to authenticate incoming webhook requests from Azure DevOps. Webhook authentication is independent of the PAT/SPN choice.
Configuration
For embedded cluster deployments, navigate to the admin console, Config tab and then to the Development Platforms section.
Select the Azure DevOps checkbox to enable Azure DevOps integration, then choose an authentication method.
For Personal Access Token, enter:
- Organization: Your Azure DevOps organization name
- Token: Your personal access token, scoped as described under Requirements
For Entra Service Principal, enter:
- Organization: Your Azure DevOps organization name
- Entra tenant ID, application (client) ID, and client secret
Webhook credentials (optional): Username and password for webhook authentication if desired.
For Helm deployments using a personal access token, add the following to your values.yaml:
platform:
  scm:
    azure:
      authType: "PAT"
      organization: "<your azure devops organization name>"
      token: "<your personal access token>"
      # Optional: For webhook authentication
      # webhook:
      #   user: "<your webhook username>"
      #   password: "<your webhook password>"
      # Use existing secret instead of creating one
      existingSecret: ""
      secretKeys:
        # -- The secret key containing the token
        tokenKey: "token"
        # -- The secret key containing the webhook password
        webhookPasswordKey: "webhookPassword"
For a Microsoft Entra service principal, set authType: "SPN" and provide the service-principal credentials instead of a token:
platform:
  scm:
    azure:
      authType: "SPN"
      organization: "<your azure devops organization name>"
      spn:
        tenantId: "<your entra tenant id>"
        clientId: "<your service principal application/client id>"
        clientSecret: "<your service principal client secret>"
      # Use existing secret instead of creating one
      existingSecret: ""
      secretKeys:
        # -- The secret key containing the service-principal client secret
        clientSecretKey: "clientSecret"
Linking a work item to Pixee's pull requests
Some Azure DevOps repositories require every pull request to reference a work item, most commonly through the Require linked work item branch policy. Others require the reference on the commit that lands on the target branch. Set a work item ID and Pixee covers both: it links that work item to every pull request it opens, and it inserts a #<work item ID> reference at the front of every commit message it writes on Azure DevOps repositories.
In the admin console, Config tab, Development Platforms section, set Work Item ID to the numeric ID of an existing work item.
platform:
  scm:
    azure:
      workItemId: "12345"
The work item must already exist in the configured organization — Pixee links an existing work item and never creates one. The same work item is linked to every pull request Pixee opens.
Warning
The credential Pixee authenticates with must have Work Items (Read & Write) access. Linking writes a relation on the work item, so with Code-only access Azure DevOps accepts the pull request, reports success, and then silently discards the link.
Which merge option each mechanism covers
Both mechanisms are needed, because which commit lands on the target branch depends on the repository's merge option. Setting Work Item ID enables both, so every merge option is covered.
| Merge option | Commit that lands on the target branch | What carries the work item reference |
|---|---|---|
| Merge (no fast-forward) | Azure DevOps generates a merge commit | the pull request link, plus the reference Pixee puts in the pull request title |
| Squash commit | Azure DevOps generates a squash commit | the same |
| Rebase and fast-forward | Pixee's own commits, replayed | the commit message itself |
| Semi-linear merge | Pixee's commits plus an Azure DevOps merge commit | both |
Azure DevOps builds its merge commit message as Merged PR <id>: <pull request title>, followed by the description and then a trailing Related work items line. That trailing line is the first content lost when Azure truncates the message, which is why Pixee puts the reference at the front of the pull request title and at the front of the commit summary line rather than at the end.
If you already set a work item ID
Before this release, Work Item ID affected pull requests only. It now also changes the commits Pixee writes: on Azure DevOps repositories every commit message begins with #<work item ID>, where it previously began with Git Commit Message Prefix, or with nothing when no prefix was set. Nothing needs to be reconfigured — but if anything downstream reads Pixee's commit message text, such as a pipeline check or a changelog generator, review it before upgrading.
Do not repeat the reference in the commit message prefix
Git Commit Message Prefix (platform.gitCommitMessagePrefix) applies to every SCM, so a prefix containing #12345 reaches your GitHub, GitLab, and Bitbucket commits too — where it means nothing, and where on GitHub #12345 cross-links whatever issue or pull request happens to have that number.
If you previously put the work item reference in the commit message prefix because it was the only way to get it onto the commit, remove it now and keep Work Item ID set. Pixee then inserts the reference on Azure DevOps repositories only.
Nothing breaks if you leave both configured. When the prefix already carries the reference as a standalone #<work item ID> token, Pixee leaves it exactly as you set it and your commit messages do not change. If your prefix wraps or punctuates the reference — [#12345], #12345: — Pixee does not recognize it and adds its own, so the reference appears twice. Removing it from the prefix avoids that.
BitBucket Cloud Integration
BitBucket Cloud integration allows Pixee Enterprise Server to work with your BitBucket repositories and requires account credentials with specific permissions.
For security, it is recommended to create and use an API token for BitBucket Cloud integration rather than using personal credentials. See the BitBucket API Token documentation for information on creating an API token.
Note
BitBucket API tokens require your account's email address for API authentication, while Git operations use your username. Make sure to configure both values.
Requirements
BitBucket Cloud integration requires:
- A BitBucket Cloud username (used for Git operations)
- Your BitBucket account email address (used for API authentication)
- An API token with the following scopes:
read:user:bitbucketread:workspace:bitbucketread:repository:bitbucketread:pullrequest:bitbucketwrite:repository:bitbucketwrite:pullrequest:bitbucket
Configuration
For embedded cluster deployments, navigate to the admin console, Config tab and then to the Development Platforms section.
Select the BitBucket checkbox to enable BitBucket Cloud integration.
Enter the following information in the configuration fields:
- Username: Your BitBucket Cloud username (used for Git operations)
- Email Address: Your BitBucket account email address (used for API authentication)
- API Token: Your BitBucket API token
For Helm deployments, add the following to your values.yaml:
platform:
  scm:
    bitbucket:
      username: "<your bitbucket cloud username>"
      emailAddress: "<your bitbucket account email address>"
      apiToken: "<your bitbucket api token>"
      # Use existing secret instead of creating one
      existingSecret: ""
      secretKeys:
        # -- The secret key containing the API token
        apiTokenKey: "apiToken"
GitHub Integration
GitHub integration allows Pixee Enterprise Server to work with GitHub.com or self-hosted GitHub Enterprise Servers and requires a custom GitHub app to be created.
Pixee Enterprise Server is able to integrate with GitHub.com and self-hosted GitHub Enterprise Servers. If you are self-hosting a GitHub enterprise server or otherwise have configured GitHub enterprise server on a domain other than github.com, see the Configuration section below for instructions on setting your custom GitHub domain.
GitHub integration comes in the form of a custom GitHub app, which will be needed to configure GitHub integration in Pixee Enterprise Server. A custom GitHub app configures webhook events, event destination, and permissions for enhanced GitHub integration. In creating this application, we have followed the best practices provided by GitHub.
Info
Network communication between your GitHub (.com or Enterprise Server) and Pixee Enterprise Server must exist. This can vary based on the deployment configuration of GitHub Enterprise Server and Pixee Enterprise Server.
GitHub App Setup
Unless otherwise instructed, leave the existing default values provided by GitHub.
- Go to https://github.com/settings/apps, replace
github.comwith your own private GitHub host as needed. - Click
New GitHub Appbutton. - Set the
GitHub App nameto something unique (i.e. "AcmePixeebotApp"), save this value for later. - Set
Homepage URLto anything (i.e. "https://pixee.ai"), this can be updated later. - Set the
Callback URLto the URL of your host/cluster in the following format http://acme.getpixee.com/api/auth/login. - Check
Request user authorization (OAuth) during installation. - Check
ActiveunderWebhook. - Set
Webhook URL, to the URL of your host/cluster in the following format http://acme.getpixee.com/github-event. - Set
Webhook Secretto a secret value, a randomly generated string will work (save this for later). -
Set these
Repository permissions:Repository permissions Access Checks Read and write Code scanning alerts Read and write Commit statuses Read and write Contents Read and write Dependabot alerts Read and write Issues Read and write Metadata Read-only Pull Requests Read and write Workflows Read and write -
Set these
Organization permissions:Organization permission Access Members Read-only -
Set these
Account permissions:Account permissions Access Email addresses Read-only -
Check to
Subscribe to eventsfor the following:- Code scanning alert
- Check Run
- Create
- Dependabot alert
- Issue Comment
- Issues
- Pull request
- Pull request review
- Pull request review comment
- Pull request review thread
- Push
- Repository
-
For
Where can this GitHub App be installed?selectOnly on this account, this can be updated later. - Click
Create GitHub Appbutton. - Once the GitHub App is created, you should see the GitHub App configuration page.
- Copy
App IDand save for later. - Scroll down and click
Generate a private key, download the private key file and save for later.
Configuration
Select your installation method for instructions.
For embedded cluster deployments, navigate to the admin console, Config tab and then to the Development Platforms section.
Select the GitHub checkbox to enable GitHub integration.
If you are self-hosting a GitHub enterprise server or otherwise have configured GitHub enterprise server on a domain other than github.com, be sure to select custom domain for the GitHub domain setting in the Pixee Enterprise Server admin console and enter your custom GitHub domain.
After creating up your GitHub App, insert the following data into the appropriate fields on the Pixee Enterprise Server admin console configuration screen:
- app name
- app id
- app private key (downloaded from browser)
For Helm deployments, add the following to your values.yaml:
platform:
  github:
    appName: "<your custom GitHub app name>"
    appId: "<your custom GitHub app id>"
    appWebhookSecret: "<your custom GitHub app webhook secret>"
    appPrivateKey: |
      -----BEGIN RSA PRIVATE KEY-----
      ...
      -----END RSA PRIVATE KEY-----
    # -- Use an existing secret instead of creating one
    existingSecret: ""
    secretKeys:
      # -- The secret key containing the appWebhookSecret
      appWebhookSecretKey: appWebhookSecret
      # -- The secret key containing the appPrivateKey
      appPrivateKeySecretKey: appPrivateKey
    # For GitHub Enterprise hosted at domains other than github.com, uncomment set your GitHub Enterprise url:
    # url: "https://github.your-company.com"
Tip
Be sure to check the indentation is correct for each line of the GitHub app private key
Verification
If you enabled GitHub integration and created a custom GitHub app, you can verify your GitHub App connectivity by checking your GitHub App's event log. This log can be accessed through your GitHub App's settings under the "Advanced" section. See GitHub.com for more information.
GitLab Integration
Pixee Enterprise Server is able to integrate with https://gitlab.com as well as self-hosted GitLab servers. If you have a self-hosted GitLab server, see the Configuration section below for instructions on setting your custom GitLab base URI.
Requirements
GitLab integration requires:
- A GitLab personal access token with the following scopes:
apiread_userread_repositoryread_apiwrite_repositoryai_featuresread_registryread_virtual_registry
- (Optional) Self-hosted GitLab server base URI if not using GitLab.com
- (Optional) Webhook secret for GitLab webhook integration
Tip
It is recommended to use a GitLab service account to generate the personal access token rather than a personal user account. Service accounts are not tied to individual users, which avoids disruption if a team member leaves or their account is modified. The service account should be granted access to the groups or projects that Pixee will manage.
Configuration
For embedded cluster deployments, navigate to the admin console, Config tab and then to the Development Platforms section.
Select the GitLab checkbox to enable GitLab integration.
Enter the following information in the configuration fields:
- Token: Your GitLab personal access token with the required scopes listed above
- Base URI (optional): Your self-hosted GitLab server URL
- Webhook secret (optional): Secret for webhook authentication
For Helm deployments, add the following to your values.yaml:
platform:
  scm:
    gitlab:
      # For self-hosted GitLab, add:
      # baseUri: "https://gitlab.your-company.com"
      token: "your-personal-access-token"  # requires scopes: api, read_user, read_repository, read_api, write_repository, ai_features, read_registry, read_virtual_registry
      # If you are using GitLab webhooks, provide the webhook secret:
      # webhookSecret: "your-gitlab-webhook-secret"
      # Use existing secret instead of creating one
      existingSecret: ""
      secretKeys:
        # -- The secret key containing the token
        tokenKey: "token"
        # -- The secret key containing the webhookSecret
        webhookSecretKey: "webhookSecret"
Webhook Configuration
If you want to use webhooks to notify Pixee of build events, you'll need to configure webhooks in your GitLab project.
The webhook URI should be: https://<example-pixee-server.com>/api/v1/integrations/gitlab-default/webhooks
For detailed instructions on configuring GitLab webhooks, see the GitLab Webhook Documentation.
The webhook secret configured in Pixee Enterprise Server should match the secret token configured in your GitLab webhook settings.
Security Integrations
This section covers integrating Pixee Enterprise Server with various security scanning and analysis tools.
Each tool section below describes how to configure that tool from the admin console or your Helm values. Read Tool Connections and Instances first: it explains how Pixee represents those connections, what the Integrations page in the product shows, and what the health indicator beside each connection means.
Tool Connections and Instances
Pixee models every connection to a security tool as an integration instance. An instance is one set of credentials pointing at one endpoint — for example, one Datadog account or one AppScan presence server. Findings arrive attached to the instance that produced them, which is what lets a scan say which connection it came from.
Where instances come from
Instances have a source, and it determines who can change them.
| Source | Where it comes from | Editable in the product |
|---|---|---|
system |
The admin console or your Helm values, as documented in the tool sections below | No |
managed |
Created in the product by a user, stored in the database | Yes, where in-product management is enabled |
Everything on this page produces a system instance. Configuring the Datadog API key in the admin
console, for example, gives you exactly one Datadog connection, derived from that configuration and
recreated on every restart. It has no database row, so nothing in the product can edit or delete it —
changing it means changing the configuration and redeploying.
The Integrations page
Users see configured tool connections under Organization → Integrations in the Pixee Platform UI. Each connection shows its name, its tool, and a health indicator:
| Indicator | Meaning |
|---|---|
| Healthy | The last check against the tool succeeded |
| Needs attention | The last check failed or reported a degraded connection |
| Unknown | No check has run against this connection |
Note
A connection records a health observation when its credentials are validated, which happens when
a user creates or edits it in the product. Nothing checks connections on a schedule yet, so a
health reading is as old as the last edit, and a system instance — one from the admin console
or Helm — always reports Unknown. Scheduled health checking is a later phase.
In-product management (opt-in)
Creating, editing and deleting connections from the product is off by default. Where it is
disabled, the Integrations page is read-only: the API serves the connection list but refuses every
write with 405 Method Not Allowed, advertising Allow: GET, HEAD, OPTIONS. The product reads that
response and hides the create, edit and delete controls, so the page reflects what the installation
actually supports rather than offering an action that would fail.
Analysis is unaffected either way. The gate governs management only — findings continue to arrive through whatever connections already exist.
In the admin console, navigate to the Config tab and find the Integrations section.
Select Enable in-product integration management, then save and deploy the update.
For Helm deployments, add the following to your values.yaml:
platform:
  integrationManagement:
    enabled: true
Either path sets PIXEE_INTEGRATIONS_MANAGEMENT_ENABLED on the platform deployment.
Enabling it does not make every tool addable. A tool can only be created in the product once the API accepts a create request for it, and today Datadog is the only one. Every other tool appears in the product's catalog for reference but has no Add action, and is configured from the admin console or Helm as described below.
HCL AppScan Integration
HCL AppScan integration allows Pixee Enterprise Server to communicate with your existing AppScan security scans to analyze, react to, fix and update issues.
Requirements
HCL AppScan integration requires:
- An AppScan Base URI (defaults to https://cloud.appscan.com)
- An AppScan Key ID and Key Secret
- The key ID must be attached to a role with permissions to post comments on issues
- Webhook authentication credentials:
- Basic Auth (recommended): Username and password for HTTP Basic authentication on incoming webhooks.
- Webhook Secret (deprecated): The secret is embedded in the webhook URL path. This method is deprecated in favor of Basic Auth.
Configuration
For embedded cluster deployments, navigate to the admin console, Config tab and then to the Security Tool section.
Select the AppScan checkbox to enable HCL AppScan integration.
Enter the following information in the configuration fields:
- Base URI: Your AppScan base URI (defaults to https://cloud.appscan.com)
- Key ID: Your AppScan key ID with comment permissions
- Key Secret: Your AppScan key secret
- Webhook Authentication Mode: Choose your authentication method:
- Basic Auth (Username/Password) (recommended): Enter username and password for HTTP Basic authentication on incoming webhooks.
- Webhook Secret (deprecated): Enter a shared secret that will be embedded in the webhook URL. This method is deprecated in favor of Basic Auth.
For Helm deployments, add the following to your values.yaml:
platform:
  pixeebot:
    appscan:
      apiKeyId: "your-appscan-key-id"
      apiKeySecret: "your-appscan-key-secret"
      webhook:
        user: "your-webhook-username"
        password: "your-webhook-password"
      # Use existing secret instead of creating one
      existingSecret: ""
      secretKeys:
        apiKeySecretKey: "apiKeySecret"
        webhookUserKey: "webhookUser"
        webhookPasswordKey: "webhookPassword"
Webhook Configuration
To receive notifications from AppScan, you'll need to configure two webhooks in your AppScan presence server using Basic Auth.
Creating the Authorization Header
First, generate the Base64-encoded authorization header using the webhook username and password you configured in Pixee Enterprise Server:
echo -n "username:password" | base64
This will output a Base64 string like dXNlcm5hbWU6cGFzc3dvcmQ=. Prepend Basic to create the full authorization header value.
Webhook 1: Scan Execution Completed
This webhook notifies Pixee Enterprise Server when an AppScan scan completes. Use the AppScan Webhook API to create it with the following request body:
{
  "AuthorizationHeader": "Basic <your-base64-encoded-credentials>",
  "PresenceId": "<your-presence-id>",
  "Uri": "https://<your-pixee-server>/api/v1/integrations/appscan-default/webhooks/_/ScanExecutionCompleted/{SubjectId}",
  "Global": true,
  "AssetGroupId": "<your-asset-group-id>",
  "Event": "ScanExecutionCompleted"
}
Webhook 2: New Patch Request
This webhook notifies Pixee Enterprise Server when a new patch is requested in AppScan. Use the AppScan Webhook API to create it with the following request body:
{
  "AuthorizationHeader": "Basic <your-base64-encoded-credentials>",
  "PresenceId": "<your-presence-id>",
  "Uri": "https://<your-pixee-server>/api/v1/integrations/appscan-default/webhooks/CreatePatch",
  "Global": true,
  "AssetGroupId": "<your-asset-group-id>",
  "Event": "NewPatchRequest",
  "RequestMethod": "POST",
  "RequestBody": "{\"patch_id\": \"{SubjectId}\"}",
  "ContentType": "application/json"
}
Placeholder Reference
Replace the following placeholders in both webhooks:
<your-base64-encoded-credentials>: The Base64-encodedusername:passwordstring from the command above<your-presence-id>: Your AppScan presence server ID<your-pixee-server>: Your Pixee Enterprise Server hostname<your-asset-group-id>: Your AppScan asset group ID
For detailed instructions on configuring AppScan webhooks, refer to the AppScan Webhook API Documentation.
Arnica Integration
Arnica integration allows Pixee Enterprise Server to communicate with your existing Arnica security platform to analyze, react to, fix and update issues.
Requirements
Arnica integration requires:
- An Arnica API key
Configuration
For embedded cluster deployments, navigate to the admin console, Config tab and then to the Security Tool section.
Select the Arnica checkbox to enable Arnica integration.
Enter the following information in the configuration fields:
- API Key: Your Arnica API key
For Helm deployments, add the following to your values.yaml:
platform:
  arnica:
    apiKey: "your-arnica-api-key"
    # Use existing secret instead of creating one
    existingSecret: ""
    secretKeys:
      # -- The secret key containing the apiKey
      apiKeyKey: "apiKey"
Black Duck Integration
Black Duck integration allows Pixee Enterprise Server to communicate with your existing Black Duck security scans to analyze, react to, fix and update issues.
Requirements
Black Duck integration requires:
- A Black Duck access token
Configuration
For embedded cluster deployments, navigate to the admin console, Config tab and then to the Security Tool section.
Select the Black Duck checkbox to enable Black Duck integration.
Enter the following information in the configuration fields:
- Access Token: Your Black Duck access token
For Helm deployments, add the following to your values.yaml:
platform:
  blackduck:
    accessToken: "your-blackduck-access-token"
    # Use existing secret instead of creating one
    existingSecret: ""
    secretKeys:
      # -- The secret key containing the accessToken
      accessTokenKey: "accessToken"
SonarQube Integration
SonarQube integration allows Pixee Enterprise Server to communicate with your existing SonarQube security scans to analyze, react to, fix and update issues.
Pixee Enterprise Server can integrate with both SonarQube Cloud and SonarQube Server.
Requirements
SonarQube integration requires:
- A SonarQube token with access to retrieve issues and hotspots for the projects that will be integrated with Pixee Enterprise Server. This may be a personal access token or, for SonarQube Cloud, a scoped organization token. When you use an organization token you must also provide your SonarQube Cloud organization key (see Organization tokens below), because SonarQube Cloud rejects organization-token requests that omit the
organizationparameter. - A webhook secret for receiving scan notifications. When creating the webhook, set the URL to
https://<domain>/api/v1/integrations/sonar-default/webhooks.
Configuration
For embedded cluster deployments, navigate to the admin console, Config tab and then to the Security Tool section.
Select the SonarQube checkbox to enable SonarQube integration. If you host your own SonarQube server instance, select SonarQube server and enter your SonarQube Server base URI and SonarQube GitHub app if applicable.
For all SonarQube integration types (Server or Cloud) enter the following information in the configuration fields:
- Token: Your SonarQube personal access token, or (SonarQube Cloud only) a scoped organization token
- SonarQube Cloud organization key: Required when authenticating with a scoped organization token. Leave blank when using a personal access token. This field is only shown for SonarQube Cloud integrations.
- Webhook Secret: Secret for webhook authentication
For Helm deployments, add the following to your values.yaml:
platform:
  sonar:
    # For SonarQube Server integration, provide your SonarQube server baseUri:
    # baseUri: "https://sonarqube.your-company.com"
    # If you have a custom Sonar GitHub app, provide the GitHub app name:
    # gitHubAppName: "your-sonarqube-github-app-name"
    # For SonarQube Cloud, when authenticating with a scoped organization token,
    # provide your organization key:
    # organization: "your-sonarqube-cloud-organization-key"
    token: "your-sonarqube-personal-access-token"
    webhookSecret: "your-sonarqube-webhook-secret"
    # -- Use an existing secret instead of creating one
    existingSecret: ""
    secretKeys:
      # -- The secret key containing the token
      tokenKey: "token"
      # -- The secret key containing the webhookSecret
      webhookSecretKey: "webhookSecret"
Organization tokens (SonarQube Cloud)
SonarQube Cloud supports two kinds of tokens:
- Personal access tokens, which are tied to an individual user account.
- Scoped organization tokens, which are owned by the organization, narrowly scoped, and independently rotatable — the recommended option for a shared integration.
When you authenticate with an organization token, SonarQube Cloud requires an organization query parameter on every API request and rejects requests that omit it with:
{"errors":[{"msg":"The 'organization' parameter is required when using an organization token"}]}
To use an organization token, set your SonarQube Cloud organization key in addition to the token:
In the admin console Security Tool section, enter your organization key in the SonarQube Cloud organization key field. This field is only shown for SonarQube Cloud integrations (it is hidden when SonarQube Server is selected).
platform:
  sonar:
    organization: "your-sonarqube-cloud-organization-key"
    token: "your-sonarqube-cloud-organization-token"
Leave organization empty when authenticating with a personal access token.
Advanced Filtering Options
SonarQube integration supports advanced filtering to control which findings are retrieved and processed.
Software Quality Filtering
Control which types of findings to retrieve:
In the admin console Security Tool section, use the following checkboxes:
- Exclude Maintainability Findings: Select to exclude maintainability findings (code smells), retrieving only security-related issues
- Exclude Reliability Findings: Select to exclude reliability findings (bugs), retrieving only security-related issues
platform:
  sonar:
    # Exclude maintainability findings (code smells)
    excludeMaintainabilityFindings: true
    # Exclude reliability findings (bugs)
    excludeReliabilityFindings: true
CWE Filtering
Filter findings by specific Common Weakness Enumeration (CWE) identifiers:
In the admin console Security Tool section:
- CWE IDs: Enter a comma-separated list of CWE IDs to filter findings (e.g.,
79,89,502,918). No spaces. When set, this overrides "Filter CWE Top 25" and "Additional CWE IDs". - Filter CWE Top 25 (Deprecated): Select to retrieve only findings from the SANS CWE Top 25 list. Ignored when "CWE IDs" is set.
- Additional CWE IDs (Deprecated): Enter comma-separated CWE IDs to include (e.g.,
611,918,1234). No spaces. Ignored when "CWE IDs" is set.
platform:
  sonar:
    # Explicit CWE ID list (overrides filterCweTop25 and additionalCweIds)
    cweIds: "79,89,502,918"
    # Deprecated - use cweIds instead
    # filterCweTop25: true
    # additionalCweIds: "611,918,1234"
Example Configurations
Custom CWE list (recommended):
platform:
  sonar:
    cweIds: "79,89,502,918"
    excludeMaintainabilityFindings: true
    excludeReliabilityFindings: true
Security + Reliability (no code smells):
platform:
  sonar:
    excludeMaintainabilityFindings: true
Legacy: SANS Top 25 only (deprecated):
platform:
  sonar:
    filterCweTop25: true
    excludeMaintainabilityFindings: true
    excludeReliabilityFindings: true
Veracode Integration
Requirements
Veracode integration requires:
- A Veracode Key ID and Key Secret
Configuration
For embedded cluster deployments, navigate to the admin console, Config tab and then to the Security Tool section.
Select the Veracode checkbox to enable Veracode integration.
Enter the following information in the configuration fields:
- Key ID: Your Veracode key ID
- Key Secret: Your Veracode key secret
For Helm deployments, add the following to your values.yaml:
platform:
  veracode:
    apiKeyId: "your-veracode-key-id"
    apiKeySecret: "your-veracode-key-secret"
    # Use existing secret instead of creating one
    existingSecret: ""
    secretKeys:
      # -- The secret key containing the apiKeySecret
      apiKeySecretKey: "apiKeySecret"
Checkmarx Integration
Checkmarx integration allows Pixee Enterprise Server to communicate with your existing Checkmarx One platform to analyze, react to, fix and update security vulnerabilities found in SAST scans.
Requirements
Checkmarx integration requires:
- A Checkmarx tenant account name. You can find this by going to your Checkmarx One platform and navigating to the
Settings>Identity and Access Managementsection. The tenant account name appears above the GUID that is your tenant ID. Be sure to use the account name, not the GUID. - API key with access to retrieve scan results and projects
- Knowledge of your Checkmarx region (US, US2, EU, EU2, DEU, ANZ, IND, SNG, or MEA)
Configuration
For embedded cluster deployments, navigate to the admin console, Config tab and then to the Security Tool section.
Select the Checkmarx checkbox to enable Checkmarx integration.
Enter the following information in the configuration fields:
- Region: Your Checkmarx region (defaults to US)
- Tenant Account Name: Your Checkmarx tenant account name
- API Key: Your Checkmarx API key
For Helm deployments, add the following to your values.yaml:
platform:
  checkmarx:
    region: "US"  # Available regions: US, US2, EU, EU2, DEU, ANZ, IND, SNG, MEA
    tenantAccountName: "your-checkmarx-tenant-account-name"
    apiKey: "your-checkmarx-api-key"
Supported Regions
Checkmarx operates in multiple regions worldwide. The following regions are supported:
- US: Default US environment (
https://ast.checkmarx.net) - US2: Second US environment (
https://us.ast.checkmarx.net) - EU: European environment (
https://eu.ast.checkmarx.net) - EU2: Second European environment (
https://eu-2.ast.checkmarx.net) - DEU: Germany environment (
https://deu.ast.checkmarx.net) - ANZ: Australia & New Zealand environment (
https://anz.ast.checkmarx.net) - IND: India environment (
https://ind.ast.checkmarx.net) - SNG: Singapore environment (
https://sng.ast.checkmarx.net) - MEA: UAE/Middle East environment (
https://mea.ast.checkmarx.net)
Make sure to select the region that matches your Checkmarx AST tenant.
How It Works
The Checkmarx integration operates as follows:
- Project Discovery: Pixee Enterprise Server discovers Checkmarx projects associated with your repositories
- Scan Retrieval: The latest SAST scan results are fetched from the Checkmarx AST platform
- Vulnerability Analysis: SAST vulnerabilities are converted to SARIF format and analyzed by Pixee's security analysis engine
- Fix Generation: Pixee identifies applicable fixes for the discovered vulnerabilities
- Pull Request Creation: Automatic fixes are applied and submitted as pull requests to the repository
The integration uses Checkmarx's REST API to retrieve project information, scan results, and vulnerability details.
GitLab SAST Integration
GitLab SAST integration allows Pixee Enterprise Server to automatically consume SAST (Static Application Security Testing) scan results from your GitLab CI/CD pipelines and apply automated fixes to security vulnerabilities.
Requirements
GitLab SAST integration requires:
- A GitLab personal access token with the following scopes:
apiread_userread_repositoryread_apiwrite_repositoryai_featuresread_registryread_virtual_registry
- A webhook secret for authenticating incoming pipeline notifications
- GitLab pipelines configured with SAST scanning (using GitLab's built-in SAST analyzer)
Tip
It is recommended to use a GitLab service account to generate the personal access token rather than a personal user account. Service accounts are not tied to individual users, which avoids disruption if a team member leaves or their account is modified. The service account should be granted access to the groups or projects that Pixee will manage.
Configuration
For embedded cluster deployments, navigate to the admin console, Config tab and then to the SCM section.
Select the GitLab checkbox to enable GitLab integration.
Enter the following information in the configuration fields:
- Base URI: The base URL of your GitLab instance (default:
https://gitlab.com) - Access Token: Your GitLab access token with the required scopes listed above
- Webhook Secret: Secret for webhook authentication
For Helm deployments, add the following to your values.yaml:
platform:
  scm:
    gitlab:
      enabled: true
      baseUri: "https://gitlab.com"  # or your GitLab instance URL
      token: "your-gitlab-access-token"  # requires scopes: api, read_user, read_repository, read_api, write_repository, ai_features, read_registry, read_virtual_registry
      webhookSecret: "your-gitlab-webhook-secret"
      # Optional: set to false for self-hosted GitLab where the service account has
      # broad read access via group or admin permissions rather than explicit
      # project membership. Defaults to true.
      memberProjectsOnly: true
      # Use existing secret instead of creating one
      existingSecret: ""
      secretKeys:
        # -- The secret key containing the token
        tokenKey: "token"
        # -- The secret key containing the webhookSecret
        webhookSecretKey: "webhookSecret"
Service Account Project Access
By default, Pixee only considers GitLab projects that the service account is an explicit member of. For self-hosted GitLab instances where the service account has broad read access via group or admin permissions — rather than explicit project membership — disable this restriction so Pixee can discover those projects.
Navigate to the admin console, select the Config tab, then go to the SCM section. Uncheck Restrict to service account member projects.
Add the following to your values.yaml:
platform:
  scm:
    gitlab:
      memberProjectsOnly: false
Webhook Configuration
To receive notifications when GitLab pipelines complete with SAST results, configure a webhook in your GitLab project or group settings.
Setting Up GitLab Webhooks
- Navigate to your GitLab project page
- Go to Settings > Webhooks
- Add a new webhook with the following configuration:
- URL:
https://<your-pixee-server.com>/api/v1/integrations/gitlab-default/webhooks - Secret Token: Use the same webhook secret configured in Pixee Enterprise Server
- Trigger Events: Select Pipeline events
- SSL verification: Enable if using HTTPS (recommended)
The webhook secret configured in GitLab must match the webhook secret configured in your Pixee Enterprise Server.
SAST Pipeline Configuration
Pixee Enterprise Server processes SAST results from two types of GitLab Pipeline Events:
- Branch Pipeline Events - Triggered when pipelines run on the default branch (e.g.,
main,develop) - Merge Request Pipeline Events - Triggered when pipelines run specifically for merge requests
SAST Configuration with Advanced Security Features
GitLab provides built-in SAST analyzers including both Semgrep and GitLab Advanced SAST. To enable comprehensive SAST scanning that works with both branch and merge request pipelines, add the following to your .gitlab-ci.yml:
workflow:
  # Run pipeline jobs on the pushes to the default branch and merge requests
  rules:
    - if: $CI_PIPELINE_SOURCE == 'merge_request_event'
    - if: $CI_COMMIT_BRANCH == $CI_DEFAULT_BRANCH

include:
  - template: Jobs/SAST.gitlab-ci.yml

variables:
  GITLAB_ADVANCED_SAST_ENABLED: true

# Override specific SAST jobs to run on merge requests
semgrep-sast:
  rules:
    - if: $CI_PIPELINE_SOURCE == 'merge_request_event'
    - if: $CI_COMMIT_BRANCH == $CI_DEFAULT_BRANCH

gitlab-advanced-sast:
  rules:
    - if: $CI_PIPELINE_SOURCE == 'merge_request_event'
    - if: $CI_COMMIT_BRANCH == $CI_DEFAULT_BRANCH
This configuration:
- Runs pipelines on merge request events and default branch pushes only
- Enables GitLab Advanced SAST in addition to the standard Semgrep-based SAST analyzer
- Explicitly configures both semgrep-sast and gitlab-advanced-sast jobs to run on merge requests
- Ensures SAST coverage for both Pixee's pull request hardening (from merge request pipelines) and repository-wide scanning (from default branch pipelines)
Pixee Enterprise Server will automatically detect and process SAST vulnerabilities from completed pipeline runs, applying fixes where possible and creating merge requests with the remediated code.
How It Works
The GitLab SAST integration operates as follows:
- Pipeline Completion: When a GitLab pipeline with SAST scanning completes, GitLab sends a webhook notification to Pixee Enterprise Server
- Vulnerability Retrieval: Pixee fetches the SAST vulnerabilities from the GitLab API for the completed pipeline
- Analysis: The vulnerabilities are converted to SARIF format and analyzed by Pixee's security analysis engine
- Fix Generation: Pixee identifies applicable fixes for the discovered vulnerabilities
- Merge Request Creation: Automatic fixes are applied and submitted as merge requests to the repository
Both regular branch pipelines and merge request pipelines are supported, with merge request pipelines triggering pull request hardening workflows for more targeted security improvements.
Alternative: Using Pixee GitLab Component
As an alternative to the webhook-based configuration described above, you can use the Pixee GitLab component for a simplified integration that does not require webhook setup.
The Pixee GitLab component is available at https://gitlab.com/pixee/pixee and provides a pre-configured CI/CD component that handles delivering SAST findings to Pixee Enterprise Server directly from your pipeline, eliminating the need for webhook configuration.
For detailed configuration options, usage instructions, and requirements, refer to the component documentation at https://gitlab.com/pixee/pixee.
Note: When using the Pixee GitLab component, you do not need to configure GitLab webhooks as described in the "Webhook Configuration" section above.
Datadog SAST Integration
Pixee Enterprise Server supports two methods for integrating with Datadog SAST:
- Native integration — connect Pixee directly to your Datadog account using API credentials configured in the admin console. Pixee fetches findings automatically.
- SARIF upload — run the open-source Datadog Static Analyzer CLI in your CI/CD pipeline and upload the SARIF output to Pixee via the API. This method does not require a Datadog account or API keys.
Method 1: Native Integration
The native integration connects Pixee directly to your Datadog account, and Pixee fetches SAST findings without any CI/CD pipeline changes.
The admin console and Helm paths below both provision a single system Datadog connection, owned by
your configuration. Datadog is also the one tool that can be connected from the product itself, so
where in-product management is enabled, users can add further
Datadog connections alongside this one — useful when teams have separate Datadog accounts. Those are
managed connections, and they are edited in the product rather than here.
Requirements
- A Datadog account with SAST enabled
- A Datadog API key and Application key
Admin Console Configuration
- In the admin console, navigate to the Config tab and find the Security Tool Integrations section.
- Check the Datadog checkbox to enable the integration.
- Enter your API Key in the field that appears.
- Enter your Application Key in the field that appears.
- Save the configuration and deploy the update.
This configures the PIXEE_PLATFORM_INTEGRATIONS_DATADOG_API_KEY and PIXEE_PLATFORM_INTEGRATIONS_DATADOG_APPLICATION_KEY environment variables on the platform deployment.
Helm Configuration (Alternative)
If you prefer to configure the integration via Helm values instead of the admin console, set the following in your values file:
platform:
  datadog:
    apiKey: "<your-api-key>"
    applicationKey: "<your-application-key>"
Or reference an existing Kubernetes secret:
platform:
  datadog:
    existingSecret: "my-datadog-secret"
    secretKeys:
      apiKeyKey: "apiKey"
      applicationKeyKey: "applicationKey"
Method 2: SARIF Upload via Datadog Static Analyzer CLI
This method uses the open-source Datadog Static Analyzer CLI to scan your codebase and upload the resulting SARIF file to Pixee via the API. It does not require a Datadog account or API keys.
Requirements
- The Datadog Static Analyzer CLI
- A Pixee authentication token. See API Access for details.
Installing the CLI
Compiled binaries of the Datadog Static Analyzer CLI can be found and downloaded from the releases page of its main Github repository. Find the release that matches the OS and architecture for the machine it will be running on.
CLI Configuration
Filtering for security-only findings
The Datadog CLI applies many rule sets when scanning a codebase, many of which are not security related. To configure which rule sets are applied, the CLI reads a YAML file named static-analysis.datadog.yml in the current working directory that specifies which rules to use. You will need to create this YAML file if you wish to filter for security-only findings.
Here's an example of a YAML configuration file that only applies Java security rules:
schema-version: v1
rulesets:
  - java-security
Datadog's rulesets follow a consistent naming convention, so this pattern can be applied to projects that use other programming languages. For example, you can use python-security for a Python project. You can even specify multiple of these rulesets if the codebase that is being scanned contains multiple programming languages.
See Datadog's SAST Rules documentation for available rulesets.
Manually running and uploading a scan to Pixee
Now that the CLI is installed and configured, it can be run in the desired codebase directory to generate a scan. To do this, invoke the following CLI command within the codebase's root directory:
datadog-static-analyzer -i . -o ./report-sarif.json -f sarif
The -o flag specifies the output scan file name and location. The -f flag specifies the output format. Pixee requires the SARIF output format. See the README for the CLI for a full list of options.
This output scan file can then be uploaded to Pixee via the API. To do this, you will need to retrieve the base URL and repository ID for the codebase you want to analyze. These can be extracted from the URL when opening the repository in Pixee Resolution Center. You can then send an HTTP POST request to the /scans endpoint for that repository using any HTTP client. Here's an example using cURL:
curl -X POST "$BASE_URL/api/v1/repositories/$REPO_ID/scans" \
  -H "Accept: application/json" \
  -H "Authorization: Bearer $PIXEE_API_KEY" \
  -F 'file=@./report-sarif.json' \
  -F 'metadata={"tool":"datadog_sast","branch":"main"};type=application/json'
This will cause Pixee to ingest all of the findings within this scan and automatically start to analyze them. You should be able to view progress on the analysis in the same repository page in Pixee Resolution Center.
Automating scan and upload in your CI/CD pipeline
Any CI/CD platform can automate the Datadog SAST scan and upload workflow. The pipeline needs to perform three steps:
- Install the Datadog Static Analyzer CLI
- Run the scan, outputting SARIF
- Upload the SARIF file to Pixee via the API
Make sure your static-analysis.datadog.yml configuration file is committed to the repository root so the CLI picks it up automatically during CI runs.
GitHub Actions example
Below is a complete GitHub Actions workflow that installs the Datadog Static Analyzer CLI, runs a scan, and uploads the results to Pixee. Add this file to your repository at .github/workflows/datadog-sast-pixee.yml.
The workflow uses three GitHub Actions secrets that you must configure in your repository settings:
PIXEE_API_KEY— your Pixee API keyPIXEE_BASE_URL— the base URL of your Pixee instance (e.g.,https://app.pixee.example.com)PIXEE_REPO_ID— the repository ID from the Pixee Resolution Center URL
name: Datadog SAST scan and upload to Pixee

on:
  push:
    branches: [main]
  pull_request:
    branches: [main]

jobs:
  datadog-sast:
    runs-on: ubuntu-latest
    steps:
      - name: Check out code
        uses: actions/checkout@v4

      - name: Install Datadog Static Analyzer CLI
        run: |
          ARCH=$(uname -m)
          case "$ARCH" in
            x86_64)  ARCH_NAME="x86_64" ;;
            aarch64) ARCH_NAME="aarch64" ;;
            arm64)   ARCH_NAME="aarch64" ;;
            *)       echo "Unsupported architecture: $ARCH"; exit 1 ;;
          esac

          LATEST=$(curl -s https://api.github.com/repos/DataDog/datadog-static-analyzer/releases/latest \
            | grep tag_name | cut -d '"' -f 4)

          curl -sL "https://github.com/DataDog/datadog-static-analyzer/releases/download/${LATEST}/datadog-static-analyzer-${ARCH_NAME}-unknown-linux-gnu.zip" \
            -o datadog-static-analyzer.zip
          unzip -o datadog-static-analyzer.zip -d /usr/local/bin
          chmod +x /usr/local/bin/datadog-static-analyzer
          rm datadog-static-analyzer.zip

      - name: Run Datadog SAST scan
        run: datadog-static-analyzer -i . -o results.sarif -f sarif

      - name: Upload SARIF to Pixee
        env:
          PIXEE_API_KEY: ${{ secrets.PIXEE_API_KEY }}
          PIXEE_BASE_URL: ${{ secrets.PIXEE_BASE_URL }}
          PIXEE_REPO_ID: ${{ secrets.PIXEE_REPO_ID }}
        run: |
          curl -X POST "$PIXEE_BASE_URL/api/v1/repositories/$PIXEE_REPO_ID/scans" \
            -H "Accept: application/json" \
            -H "Authorization: Bearer $PIXEE_API_KEY" \
            -F 'file=@./results.sarif' \
            -F 'metadata={"tool":"datadog_sast","branch":"${{ github.ref_name }}","workflow_execution_policy":"execute"};type=application/json'
This workflow does not require Datadog API or App keys — it only uses the open-source static analyzer CLI and uploads results directly to Pixee.
Advanced Settings
This section covers advanced configuration options for Pixee Enterprise Server.
External Database
For production environments, it is recommended to configure an external database when deploying into production. See the installation prerequisites for requirements.
To configure external database in Embedded Cluster deployments follow:
Navigate to the admin console, select the Config tab, then go to the Advanced Settings section. Under Database Type select External.
Provide the following information:
- Database host
- Database port
- Database username
- Database password
- Database name
To configure external database in Helm Deployment follow:
You can configure Pixee Enterprise Server to use an external database server. If you prefer to use the in-cluster, embedded database, you may skip this step.
To configure an external database, add the following to your values.yaml:
platform:
  database:
    embedded: false
    host: "<your database hostname>"
    port: "<your database server port, defaults to 5432>"
    name: "<your database name, defaults to pixee_platform>"
    username: "<your database user with access to database>"
    password: "<your database user password>"
    # -- Use an existing secret for the password instead of passing directly in Values.  Secret must contain a `password` key.
    existingSecret: "<your postgres secret name>"
Analysis Service Database (Optional)
The analysis service can use a separate logical database for episodic memory (Case-Based Reasoning). This is optional — if not configured, analysis-service runs normally without this feature.
To enable it, create an analysis_service database on your PostgreSQL server and add the following to your values.yaml:
analysis:
  database:
    host: "<your database hostname>"
    port: 5432
    name: "analysis_service"
    username: "analysis"
    password: "<your analysis database user password>"
    # -- Or use an existing secret with `username` and `password` keys.
    existingSecret: ""
Embedded Database Credential Secrets
When using the embedded database (platform.database.embedded: true), Pixee Enterprise Server automatically creates Kubernetes secrets for CloudNative-PG managed database roles used by Superset and Authentik. If you prefer to manage these secrets yourself (e.g., via an external secrets operator), you can provide your own pre-existing secrets instead.
Embedded Cluster deployments manage these secrets automatically. No additional configuration is needed.
To use existing secrets for Superset and/or Authentik database credentials, first create the secret(s):
Superset database credentials:
apiVersion: v1
kind: Secret
metadata:
  name: my-superset-postgresql-credentials
type: kubernetes.io/basic-auth
stringData:
  username: "superset"
  password: "<your-password>"
Authentik database credentials:
apiVersion: v1
kind: Secret
metadata:
  name: my-authentik-postgresql-credentials
type: kubernetes.io/basic-auth
stringData:
  username: "authentik"
  password: "<your-password>"
Then reference them in your values.yaml:
superset:
  database:
    existingSecret: "my-superset-postgresql-credentials"

authentik:
  database:
    existingSecret: "my-authentik-postgresql-credentials"
Object Store
Embedded Object Store
You can configure Pixee Enterprise Server to use an embedded object store. This is the default configuration and is suitable for development and testing environments.
When embedded object store is enabled, you will also be prompted to configure the Object Store Expiry in Days for the object store. This setting determines how long objects will be retained in the embedded object store before they are automatically deleted.
External Object Store
You can configure Pixee Enterprise Server to use an external object store. If you prefer to use the in-cluster, embedded object store, you may skip this step.
Requirements
The following are requirements of an external object store compatible with Pixee Enterprise Server:
- The object store and the Kubernetes cluster are able to communicate over the network
- The object store exposes a S3 compatible API
- A bucket has been created for use as the
pixee-analysis-inputbucket
To configure external object store in Embedded Cluster deployments follow:
Navigate to the admin console, select the Config tab, then go to the Advanced Settings section. Under Object Store Type select External.
Provide the following information:
- Object store endpoint URL
- Object store username (Access Key ID)
- Object store password (Secret Access Key)
- Bucket name for pixee analysis inputs
- Bucket name for the pixee analysis service
To configure external object store with static credentials in Helm Deployment follow:
Static Credentials
To configure an external object store, add the following to your values.yaml:
global:
  pixee:
    objectStore:
      embedded: false
      endpoint: "<your object store endpoint url>"
      username: "<your object store username>"  # Access Key ID for S3
      password: "<your object store password>"  # Secret Access Key for S3
      credentialType: "static"
platform:
  inputBucket: "<your provisioned bucket name for pixee analysis inputs>"
analysis:
  objectStore:
    bucket: "<your provisioned bucket name for the pixee analysis service>"
Service Account Authentication
For enhanced security, you can use Kubernetes service account authentication instead of static credentials. This approach leverages cloud provider IAM roles and eliminates the need for long-lived access keys.
To configure service account authentication, add the following to your values.yaml:
global:
  pixee:
    serviceAccount:
      create: false
      name: "your-external-service-account"
    objectStore:
      embedded: false
      endpoint: "<your object store endpoint url>"
      region: "<your object store region>"
      credentialType: "default"
      # username and password are not required with service account auth
platform:
  inputBucket: "<your provisioned bucket name for pixee analysis inputs>"
analysis:
  objectStore:
    bucket: "<your provisioned bucket name for the pixee analysis service>"
Git Clone Strategy
Pixee Enterprise Server supports two Git cloning strategies for VCS operations:
- Partial Clone (Default): Downloads only the specific commit, tree, and blob objects needed for the requested revision. This provides optimal performance and minimal bandwidth usage but may not be supported by all Git servers.
- Full Clone: Downloads the complete repository including all history, branches, and objects. While this requires more time and bandwidth, it ensures maximum compatibility with all Git servers.
To configure the Git clone strategy in Embedded Cluster deployments:
Navigate to the admin console, select the Config tab, then go to the Advanced Settings section. Under Git Clone Strategy, select either:
- Partial (recommended - faster, less bandwidth): For optimal performance
- Full (maximum compatibility): For environments where partial clones are not supported
To configure the Git clone strategy in Helm deployments, add the following to your values.yaml:
platform:
  gitCloneStrategy: "partial"  # or "full" for maximum compatibility
The default value is partial for optimal performance. Change to full if you encounter issues with Git servers that don't support partial clones.
Git Author Identity
When using a service account for Git operations (e.g., a GitLab service account), you may need to configure the author email and username that Pixee uses when creating commits. You can retrieve these values from your VCS provider's API:
# GitLab example — username
curl -s -H "Authorization: Bearer $GITLAB_TOKEN" "https://gitlab.com/api/v4/user" | jq '.username'

# GitLab example — email (separate endpoint)
curl -s -H "Authorization: Bearer $GITLAB_TOKEN" "https://gitlab.com/api/v4/user/emails" | jq '.[0].email'
Navigate to the admin console, select the Config tab, then go to the Advanced Settings section. Under Git Author Email and Git Author Username, enter the service account's email and username.
Add the following to your values.yaml:
platform:
  gitAuthorEmail: "service-account@example.com"
  gitAuthorUsername: "pixee-bot"
Error Reporting
By default, Pixee Enterprise Server will send error and crash reports to Pixee via Sentry.io.
To configure error reporting in Embedded Cluster deployments follow:
Navigate to the admin console, select the Config tab, then go to the Advanced Settings section.
To disable automatic error and crash reporting, uncheck the error reporting option.
To configure error reporting in Helm Deployment follow:
To disable automatic error and crash reporting, add the following to your values.yaml:
global:
  pixee:
    sentry:
      enabled: false
HTTP(S) Proxy Settings
You can configure Pixee Enterprise Server to route HTTP/HTTPS traffic through a proxy server.
NO_PROXY Configuration Limitations
Important: NO_PROXY Wildcard Limitations
The NO_PROXY environment variable in Pixee Enterprise Server does not support wildcard patterns. You must specify exact hostnames or IP addresses.
Not Supported:
NO_PROXY=*.internal.company.com
NO_PROXY=10.0.*.*
Supported (Required Format):
NO_PROXY=service1.internal.company.com,service2.internal.company.com,10.0.1.5,10.0.2.10
This limitation means that if you have multiple internal services that should bypass the proxy, each hostname must be explicitly listed in the NO_PROXY configuration.
To configure HTTP(S) proxy in Embedded Cluster deployments follow:
Navigate to the admin console, select the Config tab, then go to the Advanced Settings section.
Select the Configure HTTP(S) Proxy checkbox if you need to route HTTP/HTTPS traffic through a proxy server. Once enabled, you can configure or modify the HTTP and HTTPS proxy server addresses as well as provide a comma separated list of domains to exclude from using your HTTP/HTTPS proxy.
Note: The NO_PROXY field requires exact hostnames or IP addresses. Wildcard patterns are not supported.
To configure HTTP(S) proxy in Helm Deployment follow:
Add the following to your values.yaml:
global:
  pixee:
    httpProxy: "<address>:<port>"     # HTTP proxy server host/address and port
    httpsProxy: "<address>:<port>"    # HTTPS proxy server host/address and port
    noProxy: "<comma,separated,hosts>" # Comma separated list of exact hostnames/IPs to exclude from proxy (wildcards not supported)
Example configuration:
global:
  pixee:
    httpProxy: "proxy.company.com:8080"
    httpsProxy: "proxy.company.com:8080"
    noProxy: "kubernetes.default,kubernetes.default.svc,10.0.0.1,database.internal.company.com,api.internal.company.com"
Private CA Certificates
If your environment uses self-signed certificates or a private Certificate Authority (CA), you can configure Pixee Enterprise Server to trust these certificates.
Embedded Cluster automatically detects and uses the host system's CA trust store at install time. Ensure your private CA certificates are installed on the host before running the Embedded Cluster installer — no additional Pixee configuration is needed.
Updating CA certificates after installation:
If you need to add new CA certificates after the initial installation:
- Update the host's CA trust store (e.g. add the certificate and run
update-ca-trust) -
Wait up to one hour for the
kotsadm-private-casConfigMap to refresh automatically, or force an immediate refresh:kubectl rollout restart deployment/embedded-cluster-operator -n embedded-cluster -
Restart the Pixee platform deployment to pick up the new certificates:
kubectl rollout restart deployment/pixee-platform -n <namespace>
Create a ConfigMap containing your PEM-encoded CA certificate(s):
kubectl create configmap my-ca-certs \
  --from-file=ca.pem=/path/to/your/ca-certificate.pem \
  -n <namespace>
Then reference it in your values.yaml:
global:
  pixee:
    privateCACert: "my-ca-certs"
The ConfigMap may contain one or more PEM files, each with one or more certificates. All certificates will be imported into the trust stores used by the platform, analysis, and forge services.
Updating CA certificates:
To add or replace certificates, update the ConfigMap and restart the platform deployment:
kubectl rollout restart deployment/pixee-platform -n <namespace>
Deprecated: Skip SSL Verification
The global.pixee.skipSSLVerification Helm value (and the corresponding KOTS admin console checkbox) is deprecated and will be removed in a future release. This setting disables ALL certificate verification for outbound HTTPS connections, which is a security risk. Use private CA certificates instead.
Host Aliases
You can configure a custom host-to-IP mapping (/etc/hosts entry) for the Platform pods. This is useful for environments with private DNS, split-horizon DNS, or services not resolvable via the cluster's DNS.
To configure host aliases in Embedded Cluster deployments:
Navigate to the admin console, select the Config tab, then go to the Advanced Settings section. Select the Enable Custom Host Aliases checkbox.
Once enabled, enter host aliases in /etc/hosts format in the text area — one entry per line, with an IP address followed by one or more space-separated hostnames. Lines starting with # are treated as comments and ignored.
Example:
10.0.0.1 service.internal api.internal
192.168.1.100 db.internal
To configure host aliases in Helm deployments, add the following to your values.yaml:
platform:
  hostAliases:
    - ip: "10.0.0.1"
      hostnames:
        - "service.internal"
        - "api.internal"
Each entry maps an IP address to one or more hostnames, which are added to the pod's /etc/hosts file.
Metrics Reporting
By default, Pixee Enterprise Server will send anonymized usage metrics to Pixee.
To configure metrics reporting in Embedded Cluster deployments follow:
Navigate to the admin console, select the Config tab, then go to the Advanced Settings section.
To disable metrics reporting, uncheck the metrics reporting option.
To configure metrics reporting in Helm Deployment follow:
To disable metrics reporting, add the following to your values.yaml:
global:
  pixee:
    metrics:
      enabled: false
Object Store Signature Duration
By default, Pixee Enterprise Server generates pre-signed URLs for object store operations with a system-defined expiration duration. You can customize this duration by configuring the signature duration setting.
The duration should be specified as a string with time units. Common examples: "1h" (1 hour), "30m" (30 minutes), "2h" (2 hours), "45m" (45 minutes). If not configured, the system will use its default behavior.
To configure signature duration in Embedded Cluster deployments follow:
Navigate to the admin console, select the Config tab, then go to the Advanced Settings section. Locate the Object Store Signature Duration field.
To configure signature duration in Helm Deployment follow:
To configure a custom signature duration for pre-signed URLs, add the following to your values.yaml:
platform:
  inputSignatureDuration: "<duration>"
Reverse Proxy Settings
If your Pixee Enterprise Server is accessible via a reverse proxy (i.e., ALB, App Gateway, NGINX, etc.), you may need to configure additional settings.
Two requirements that come before the reverse proxy settings
1. Domain name must be the hostname browsers use. Pixee builds every browser-facing URL from the Domain name in the Network settings — the OIDC authorization endpoint, the OAuth2 redirect_uri, the token issuer, and the logout URL are all absolute URLs fixed at deploy time from that value. Set it to the cluster's own address or to the origin address your proxy was configured with, and clicking Continue on the login page redirects the browser to a host it cannot reach (ERR_CONNECTION_TIMED_OUT). No X-Forwarded-* header changes this: those URLs are not reconstructed per request.
2. Your proxy must send that same hostname in the Host header. The cluster's gateway routes on Host alone — it serves only requests whose Host matches Domain name, and it does not consult X-Forwarded-Host. A proxy that rewrites Host to its own origin address therefore gets 404 Not Found on every request, before anything reaches the application at all. Authentik itself is more tolerant here: it accepts X-Forwarded-Host or Host when building its own URLs. That tolerance does not help, because the request never gets past the gateway to reach it.
The two must agree: Domain name and the Host header your proxy sends are the same value. Forwarded headers are useful in addition to this, never instead of it.
Where the proxy cannot be changed, Additional accepted hostnames lets the cluster answer to the rewritten Host as well, while Domain name stays the public hostname — see When You Cannot Change the Proxy. It resolves requirement 2 only; requirement 1 is unchanged.
Which forwarded headers your proxy actually needs
Once Host carries the public hostname, X-Forwarded-Host is redundant — the gateway matches on Host, Authentik accepts Host, and the browser-facing OIDC URLs come from Domain name rather than from any header. Sending it does no harm, but it is not what makes the deployment work.
Two of its siblings are not redundant:
X-Forwarded-Proto— required whenever your proxy terminates TLS and forwards HTTP to the cluster. Without it the application generateshttp://links for anything it builds per request.X-Forwarded-Port— required when the public URL uses a non-standard port that theHostheader does not carry.
Your proxy should also strip any inbound X-Forwarded-* headers it did not set itself, since the application trusts the ones it receives.
To configure reverse proxy settings in Embedded Cluster deployments follow:
Navigate to the admin console, select the Config tab, then go to the Network Settings section. Every setting in this section — the domain name, the port, the reverse proxy options, and the TLS options — is configured there together.
- Check Behind a reverse proxy, load balancer, or CDN
- Select TLS Termination:
- TLS at this server — the server serves HTTPS and the reverse proxy forwards encrypted traffic
- TLS at reverse proxy — the reverse proxy terminates TLS and forwards HTTP to the cluster
- No TLS (HTTP only) — no encryption, not recommended for production
To configure reverse proxy settings in Helm Deployment follow:
Add the following applicable settings to your values.yaml:
global:
  pixee:
    # Set externalProtocol when the reverse proxy terminates TLS and the cluster serves HTTP
    externalProtocol: "https"  # protocol used by browsers (omit to use the same as protocol)
platform:
  proxy:
    enabled: true
Forwarded headers are always honored, and are never filtered by proxy address
Pixee Enterprise Server honors X-Forwarded-Proto, X-Forwarded-Port, X-Forwarded-Host and Forwarded on every deployment, and there is no setting that turns that off. It trusts whichever client sent them and offers no trusted-proxy allow-list, so rejecting forwarded headers from unexpected sources has to happen at your proxy — which should strip any inbound X-Forwarded-* headers it did not set itself.
Releases before 6.1 exposed a Reverse Proxy Forwarded Headers checkbox and a Reverse Proxy Address Filter field in the admin console, along with platform.proxy.address and platform.proxy.headers.* in Helm. None of them ever took effect — the checkbox was read by no template at all, and the address filter rendered a Tomcat trusted-proxy setting that the forward-headers strategy this chart always uses ignores — and all of them have been removed. Leaving them in an existing values.yaml is harmless — Helm ignores unrecognized values — but they never provided the trusted-proxy boundary the address filter's wording implied.
None of this affects the browser-facing OIDC URLs, which are built from Domain name and never from a request header.
The cluster restores X-Forwarded-Proto when your proxy terminates TLS
Envoy sets X-Forwarded-Proto from the port the request arrived on and overwrites whatever your proxy sent, so with TLS Termination set to TLS at reverse proxy the header would otherwise reach the application as http even though the browser is on https. Components that build URLs from the request — Authentik most visibly, since it publishes the OIDC issuer and authorization endpoint — would then advertise http:// endpoints, and sign-in fails with no message naming a scheme.
The gateway routes therefore set the header back to the browser-facing scheme. This happens automatically from TLS Termination; there is no setting for it, and nothing changes on a deployment that serves HTTPS from the cluster.
CDNs and Proxies That Rewrite the Host Header
Many proxies default to replacing the Host header with the address of the origin they were configured with, rather than passing through the hostname the client requested. Because the cluster's gateway serves only requests whose Host matches the Domain name setting, each of these needs an explicit override:
| Product | Setting | Value |
|---|---|---|
| Azure Front Door | Origin → Origin host header | your public endpoint hostname (e.g. contoso.azurefd.net), not the origin IP or FQDN |
| Azure Application Gateway | Backend setting → Override with new host name | Off, so the incoming host is preserved — or set explicitly to the public hostname |
| AWS CloudFront | Origin request policy | include Host in the headers forwarded to the origin |
| AWS ALB / NLB | — | preserved by default; no action needed |
| NGINX | proxy_set_header Host $host; |
($host, not $proxy_host) |
| HAProxy | leave Host untouched |
do not http-request set-header Host |
Setting Domain name to the public hostname and configuring the host-header override are a single change — apply both together. Changing only Domain name makes the gateway reject every request; changing only the proxy leaves the login redirects pointing at the internal address.
When You Cannot Change the Proxy
Preserving the original Host at the proxy is the recommended configuration, and the rest of this section assumes it. Where the proxy is managed by another team and cannot be changed, Additional accepted hostnames is the fallback: it tells the cluster to answer to further Host values on top of Domain name.
Set the two together:
- Domain name — the hostname users type in their browser. Every browser-facing URL is built from this, so it must stay the public hostname.
- Additional accepted hostnames — the address the proxy actually sends, as a comma-separated list (for example the origin IP,
10.0.90.4).
- Enable Behind a reverse proxy, load balancer, or CDN
- Leave Domain name set to your public hostname
- Enter the proxy's origin address in Additional accepted hostnames
global:
  pixee:
    domain: "pixee.example.com"        # public hostname; browser-facing URLs
    gatewayHostnames:                  # what the proxy actually sends
      - "10.0.90.4"
This setting widens routing only — it is not a second domain. Requests arriving with either Host are routed, and every browser-facing URL continues to be built from Domain name alone. That is deliberate: the two values exist precisely so that a rewritten Host does not drag the OIDC redirects onto an address the browser cannot reach.
It is also the mechanism for a zero-downtime rename: add the new hostname, cut the DNS and the proxy over, change Domain name, then drop the old entry.
Validate sign-in before relying on this in production
This setting fixes routing — requests stop returning 404. It does not change how Authentik derives the absolute URLs it generates per request, and the CLI device flow compares the token issuer as an exact string. Both depend on the proxy forwarding X-Forwarded-Host with the original hostname. Confirm browser sign-in, pixee login from the CLI, and the Superset dashboards in a non-production environment before rolling this out; if any of them fail, the supported fix remains the host-header override in the table above.
Not available with a cluster-generated or Let's Encrypt certificate
Accepting more than one hostname requires the gateway's listener to stop filtering by name, and that listener hostname is exactly what cert-manager derives the certificate's DNS names from. With TLS Options set to Generate or Request, clearing it would leave the certificate never issued on a new install, and never renewed on an existing one — HTTPS would fail weeks later, far from the setting that caused it. Rather than ship that, the deployment refuses to start with both configured, naming this setting in the error.
Two supported combinations:
- Protocol → HTTP, with TLS Termination → TLS at reverse proxy — the proxy terminates TLS and the cluster serves plain HTTP, so no certificate is involved. This is the usual arrangement behind a CDN.
- Protocol → HTTPS, with TLS Options → Upload TLS certificate — you supply the certificate, so nothing is derived from the listener. Include every accepted hostname in it, or use a certificate the proxy is configured not to validate by name.
TLS Termination → TLS at reverse proxy is not sufficient by itself. That setting controls the scheme in browser-facing URLs; it does not change what this server serves. Leaving Protocol on HTTPS with TLS Options on Generate or Request keeps the certificate in play and the deployment will still refuse to start. Change it as well.
Do not cache authentication endpoints
A CDN in front of Pixee must not cache /authentik/* or /api/*. Caching an OIDC authorization response — or caching with a cache key that ignores query strings, which is the default on several CDNs once caching is switched on — makes Authentik serve a stale response to a request carrying entirely different OAuth2 parameters. The symptom is an Authentik Client ID Error — the client identifier (client_id) is missing or invalid page even though the URL plainly contains client_id=pixee. Disable caching on the route, or confine it to static asset paths and set the cache key to use the full query string.
Origin certificate validation
If your CDN or proxy reaches the cluster over HTTPS, changing the host header it sends also changes the name it validates the origin certificate against. Either install a certificate on the cluster matching the public hostname, disable origin certificate subject-name validation on the proxy, or terminate TLS at the proxy and set TLS Termination to TLS at reverse proxy.
Non-Standard Port (Load Balancer)
If your load balancer exposes Pixee Enterprise Server on a non-standard port (e.g., port 5443 instead of 443), additional configuration is required so that OIDC authentication redirects include the correct port.
Set the port here, and forward it too
Entering the port in the Non-standard port field is what puts it into the OIDC authorization endpoint and redirect_uri — those are absolute URLs built from Domain name plus this port, so the setting is required.
Your load balancer should also forward the port, via one of these headers:
X-Forwarded-Hostwith the port included (e.g.,X-Forwarded-Host: yourdomain.com:5443), orX-Forwarded-Portas a separate header (e.g.,X-Forwarded-Port: 5443)
That is what carries the port into the other absolute links the application generates per request. Most load balancers (ALB, HAProxy, NGINX) set these automatically for non-standard ports.
- Check Use non-standard port? at the end of the section
- Enter the port number in Non-standard port (e.g.,
5443)
This applies whether or not a reverse proxy is configured, so a deployment reached on a NodePort can set it too.
The non-standard port setting is what puts the port into the browser-facing OIDC URLs (authorization endpoint, redirect_uri, end-session endpoint). The X-Forwarded-Host / X-Forwarded-Port headers from your load balancer carry it into the rest of the absolute links the application generates.
Add the port to your values.yaml:
global:
  pixee:
    port: "5443"  # your non-standard port
platform:
  proxy:
    enabled: true
How it works
The OIDC URLs are fixed at deploy time, not reconstructed from request headers:
- Browser-facing OIDC URLs — the authorization endpoint, the OAuth2
redirect_uri, the token issuer, and the end-session URL — are absolute URLs built fromDomain name, the TLS configuration, and the non-standard port. Entering the port is what puts it into all of them. - Forwarded headers apply to the other absolute links the application generates per request. They do not override the browser-facing OIDC URLs, so forwarded headers alone cannot compensate for a wrong Domain name or a missing port.
Both are needed for the full flow to work with a non-standard port, but only the Non-standard port setting affects the OIDC URLs.
Analysis Timeout Settings
Pixee Enterprise Server uses a two-tier timeout model to decide when an in-progress analysis is stuck and should be failed. Both tiers run continuously; whichever trips first ends the analysis. The idle timeout must always be shorter than the progress-stall timeout.
Idle timeout (Tier 1)
The idle timeout controls how long the platform waits without any sign of life from the analysis service — any streaming event (keepalive pings included) or result callback. Because keepalives reset it, the idle timeout only needs to be long enough to detect a genuinely silent or dead analysis. Default: 15m.
In the admin console this is Analysis idle timeout; in Helm it is platform.analysisTimeout. (The underlying setting key is unchanged from earlier releases for upgrade compatibility.)
Progress-stall timeout (Tier 2)
The progress-stall timeout controls how long the platform waits without the analysis completing any result outcome. Unlike the idle timeout, keepalives do not reset it — only real progress (a completed finding) does. This reclaims an analysis that keeps pinging but is not making progress, while letting a legitimately long analysis (for example, one with many findings) run as long as it keeps completing findings, regardless of total elapsed time. Default: 45m.
In the admin console this is Analysis progress-stall timeout; in Helm it is platform.analysisMaxProgressStall.
SAST and SCA analysis timeouts (deprecated)
Deprecated.
sastAnalysisTimeout/scaAnalysisTimeoutare superseded by the idle and progress-stall timeouts above, which apply uniformly across analysis types. They are still honored if set, but will be removed in a future release — leave them unset. Note that the idle timeout's behavior changed (it is now reset by keepalives rather than only by completed outcomes), and an idle timeout larger than the progress-stall timeout has no effect because the progress-stall timeout trips first.
To configure analysis timeouts in Embedded Cluster deployments:
Navigate to the admin console, select the Config tab, then go to the Advanced Settings section.
- Analysis idle timeout: Tier 1 — silence detection; reset by any event including keepalives (default: 15m)
- Analysis progress-stall timeout: Tier 2 — reset only by completed outcomes (default: 45m)
- SAST analysis timeout (deprecated): leave unset
- SCA analysis timeout (deprecated): leave unset
The duration should be specified as a string with time units. Common examples: "15m" (15 minutes), "30m" (30 minutes), "1h" (1 hour). The idle timeout must be less than the progress-stall timeout.
To configure analysis timeouts in Helm deployments, add the following to your values.yaml:
platform:
  analysisTimeout: "15m"            # Tier 1 idle timeout (reset by any event, keepalives included)
  analysisMaxProgressStall: "45m"   # Tier 2 progress-stall timeout (reset only by completed outcomes)
  # sastAnalysisTimeout / scaAnalysisTimeout are deprecated and will be removed in a future release
Analysis Queue Max Concurrency
Controls the maximum number of analyses the platform dispatches to the analysis service at once. The analysis service applies back-pressure (HTTP 429 with Retry-After) when it cannot accept more work, so this knob primarily caps how many in-flight analyses the platform will hold open concurrently.
Leave the value blank or unset to use the platform default. Raise it when the analysis service has spare capacity and you want to increase throughput; lower it to be more conservative.
Navigate to the admin console, select the Config tab, then go to the Advanced Settings section. Set Analysis queue max concurrency to a positive integer (e.g., 10). Leave it blank to keep the platform default.
Add the following to your values.yaml:
platform:
  analysisQueueMaxConcurrency: "10"
Omit the value to keep the platform default.
Analysis Service Memory Limit
Sets the memory ceiling for the analysis service pod. Raise it if analyses fail with out-of-memory errors — the analysis pod is OOMKilled (restarts with exit code 137) — which can happen on large repositories or under high analysis concurrency. When the pod is killed mid-run, its in-flight work surfaces as errors on the Classification and Fix stages.
The default is 8Gi. The value must be a Kubernetes resource quantity in whole GiB (e.g., 8Gi, 16Gi).
Navigate to the admin console, select the Config tab, then go to the Advanced Settings section. Set Analysis service memory limit to a whole-GiB quantity (e.g., 16Gi).
Add the following to your values.yaml:
analysis:
  resources:
    limits:
      memory: 16Gi
Agentic Triage Analyzer Strategy
Controls which AI reasoning approach is used for triage analysis across all rules.
Available strategies:
- decision-tree (default) — Autonomous agent that emulates a human-led triage process
- react — Multi-step reasoning with tool use
- react-holistic — Broader context analysis with tool use
- claude-agent — Claude-powered autonomous agent
- anthropic-agent — Anthropic SDK-based autonomous agent
Navigate to the admin console, select the Config tab, then go to the Advanced Settings section. Select the desired strategy from the Agentic Triage Analyzer Strategy dropdown.
To configure the agentic triage analyzer strategy in Helm deployments, add the following to your values.yaml:
analysis:
  agenticTriageAnalyzerStrategy: decision-tree
Project Context
When enabled, project-level contextual analysis is used to inform triage and fix analysis results. This allows the analysis engine to consider broader project context when evaluating findings, leading to more accurate triage decisions and higher quality fixes.
This setting is enabled by default.
Navigate to the admin console, select the Config tab, then go to the Advanced Settings section. Locate the Enable Project Context checkbox.
To enable project context in Helm deployments, add the following to your values.yaml:
analysis:
  enableProjectContext: true
SCA Max Requests to Analyze
Controls the maximum number of requests to analyze during SCA (Software Composition Analysis). This limits the upper bound of dependency requests that SCA will process per analysis, helping to manage resource usage for repositories with large dependency trees.
The default value is 5.
Navigate to the admin console, select the Config tab, then go to the Advanced Settings section. Locate the SCA Max Requests to Analyze field and enter the desired value.
To configure the SCA max requests to analyze in Helm deployments, add the following to your values.yaml:
analysis:
  scaMaxRequestsToAnalyze: 5
SCA Exploitability Fix Shortcircuit
When enabled, fix generation is skipped for findings that SCA (Software Composition Analysis) determines are not exploitable. This reduces unnecessary compute usage by not generating fixes for vulnerabilities that cannot be reached in practice.
This setting is disabled by default.
Navigate to the admin console, select the Config tab, then go to the Advanced Settings section. Locate the Skip fix for non-exploitable SCA findings checkbox.
To enable this optimization in Helm deployments, add the following to your values.yaml:
analysis:
  useScaExploitabilityToShortcircuitFix: true
Vendored File Triage
When enabled, a specialized triage strategy is used for vendored files. This improves the accuracy of analysis results for files that are vendored (copied from external sources) rather than authored in-house.
This setting is enabled by default.
Navigate to the admin console, select the Config tab, then go to the Advanced Settings section. Locate the Enable vendored file triage checkbox.
This is enabled by default. To disable it in Helm deployments, add the following to your values.yaml:
analysis:
  enableVendoredFileTriage: false
Analysis Input Caching
The analysis service supports URL-based input caching to improve performance for repeated analyses. When enabled, downloaded analysis inputs are cached locally to avoid redundant downloads.
Caching is enabled by default with a 24-hour TTL and 10GB maximum cache size.
Navigate to the admin console, select the Config tab, then go to the Advanced Settings section.
- Enable analysis input caching: Toggle to enable or disable caching (enabled by default)
- Analysis cache TTL (seconds): Set the time-to-live for cached inputs (default: 86400 seconds / 24 hours)
To configure analysis input caching in Helm deployments, add the following to your values.yaml:
analysis:
  cache:
    enabled: true
    defaultTtlSeconds: 86400     # 24 hours
    maxSizeBytes: 10737418240    # 10GB
    honorCacheControl: true
Analysis Backpressure
The analysis backpressure feature enables the analysis service to proactively cancel analyses that cannot successfully complete within platform timeout limits. This helps prevent wasted compute resources on analyses that would eventually timeout.
This setting is enabled by default.
To configure analysis backpressure in Embedded Cluster deployments:
Navigate to the admin console, select the Config tab, then go to the Advanced Settings section. Locate the Enable analysis backpressure checkbox.
- Enabled (default): The analysis service will proactively cancel analyses that cannot complete in time
- Disabled: Analyses will run until they complete or timeout naturally
To configure analysis backpressure in Helm deployments, add the following to your values.yaml:
analysis:
  backpressureEnabled: true  # or false to disable
LLM Adaptive Concurrency Limiter
The LLM adaptive concurrency limiter uses an AIMD (Additive Increase / Multiplicative Decrease) algorithm to dynamically adjust the number of concurrent LLM requests the analysis service sends. When disabled, no concurrency gating is applied but coordinated Retry-After backoff still works.
This setting is disabled by default.
To configure the LLM adaptive concurrency limiter in Embedded Cluster deployments:
Navigate to the admin console, select the Config tab, then go to the Advanced Settings section. Locate the Enable LLM adaptive concurrency limiter checkbox.
- Disabled (default): No adaptive concurrency gating; Retry-After backoff still applies
- Enabled: The AIMD adaptive concurrency limiter actively gates outbound LLM requests
To configure the LLM adaptive concurrency limiter in Helm deployments, add the following to your values.yaml:
analysis:
  llmConcurrencyEnabled: true  # or false to disable
Automatic Threat Model Refresh
When enabled, the platform automatically refreshes a repository's threat model on SCM events — when a repository is onboarded and when commits land on its default branch. When disabled (default), threat models are only regenerated on demand.
To configure automatic threat model refresh in Embedded Cluster deployments:
Navigate to the admin console, select the Config tab, then go to the Advanced Settings section. Locate the Enable Automatic Threat Model Refresh checkbox.
- Enabled: The platform refreshes threat models on repository onboarding and on pushes to the default branch
- Disabled (default): Threat models are refreshed only on demand
To configure automatic threat model refresh in Helm deployments, add the following to your values.yaml:
platform:
  threatModelRefreshEnabled: true  # or false to disable (default)
Pull-Request Feedback Capture
When enabled, the platform captures developer reactions on Pixee-generated pull requests — comments (including @PixeeBot mentions), reviews, closes, and pushed commits — from GitHub webhooks. Each captured event is written to the analysis service's episodic-memory store so case-based reasoning agents can consult it when triaging or fixing similar findings later.
When disabled (default), no PR feedback is captured or written to memory. The database migration and admin resource are present either way, so this flag can be toggled without a data migration.
To configure pull-request feedback capture in Embedded Cluster deployments:
Navigate to the admin console, select the Config tab, then go to the Advanced Settings section. Locate the Enable Pull-Request Feedback Capture checkbox.
- Enabled: The platform captures comments, reviews, closes, and pushed commits on Pixee-generated PRs and writes each event to the analysis service's episodic-memory store
- Disabled (default): No PR feedback is captured or stored
To configure pull-request feedback capture in Helm deployments, add the following to your values.yaml:
platform:
  prFeedbackEnabled: true  # or false to disable (default)
SCA Chain Resolution (Experimental)
SCA chain resolution adds a prefilter pre-step to the SCA orchestrator for both direct and transitive dependency flows. When disabled (default), SCA behavior is unchanged.
This setting is disabled by default and is considered experimental — recommended rollout is to enable in a staging environment first and confirm the orchestrator logs show chain_resolution_prefilter step entries before promoting to higher environments.
To configure SCA chain resolution in Embedded Cluster deployments:
Navigate to the admin console, select the Config tab, then go to the Advanced Settings section. Locate the Enable SCA Chain Resolution (Experimental) checkbox.
- Enabled: The SCA orchestrator runs the chain resolution prefilter as a pre-step
- Disabled (default): SCA behavior is unchanged
To configure SCA chain resolution in Helm deployments, add the following to your values.yaml:
analysis:
  enableScaChainResolution: true  # or false to disable (default)
Guardrail-Rewrite Detection
The analysis service runs a heuristic detector on responses from OpenAI and Azure-OpenAI LLM providers that recognizes when a provider-side safety guardrail has rewritten or refused the requested fix. Two independent flags control this behavior:
- Guardrail-Rewrite Detection (
guardrailDetectionEnabled) is the master switch. When disabled, the scan is skipped entirely — no metrics, no breadcrumb onFindingContext.fix_caveats, no per-phase marking, and no abort in the fix retry loops. Disable this when you want the feature completely off (for example, if you observe unexpected scan overhead or do not trust the detector in a given environment). - Abort fix retries on guardrail detection (
guardrailShortCircuitEnabled) controls only the abort behavior. When disabled, detection still runs (metrics and breadcrumbs continue to emit, so dashboards stay populated) but the fix retry loops inagentic_fast,impl, andfix_plannerwill not abort on a detection. Flip this off first if false-positive aborts appear in production while you want to preserve the observability signal. This setting has no effect when Guardrail-Rewrite Detection is disabled.
Both settings are enabled by default. The recommended starting configuration is to leave them on and only disable guardrailShortCircuitEnabled if false-positive aborts emerge.
To configure guardrail-rewrite detection in Embedded Cluster deployments:
Navigate to the admin console, select the Config tab, then go to the Advanced Settings section. Locate the Enable Guardrail-Rewrite Detection and Abort fix retries on guardrail detection checkboxes.
To configure guardrail-rewrite detection in Helm deployments, add the following to your values.yaml:
analysis:
  guardrailDetectionEnabled: true     # or false to disable detection entirely (default true)
  guardrailShortCircuitEnabled: true  # or false to keep detection but skip retry aborts (default true)
Verify Installation
After installation is complete, you can verify your installation with the following steps.
Health Check Endpoint
Both deployment methods provide the same health check endpoint to verify the Pixee Enterprise service status:
curl https://<domain or ip>/actuator/health/readiness
Expected response:
{
    "status": "UP",
    "checks": [
        {
            "name": "SmallRye Reactive Messaging - liveness check",
            "status": "UP"
        },
        {
            "name": "Pixee Server health check",
            "status": "UP",
            "data": {
                "server-version": "2024-11-03-653a81d"
            }
        },
        {
            "name": "Database connections health check",
            "status": "UP",
            "data": {
                "<default>": "UP"
            }
        },
        {
            "name": "SmallRye Reactive Messaging - readiness check",
            "status": "UP"
        },
        {
            "name": "SmallRye Reactive Messaging - startup check",
            "status": "UP"
        }
    ]
}
Kubernetes Resources
To verify Kubernetes resources in Embedded Cluster deployments follow:
-
Open a terminal session on the VM and run the following commands:
sudo ./pixee shell kubectl get all -n kotsadm -
Verify the Pixee Enterprise Server is ready by viewing pods and services, making sure all are in the
readystate.
To verify Kubernetes resources in Helm Deployment follow:
Verify the application is properly deployed by viewing pods and services, making sure all are in the ready state:
kubectl get all -n pixee-enterprise-server
GitHub App Connectivity
If you enabled GitHub integration and created a custom GitHub app, you can verify your GitHub App connectivity by checking your GitHub App's event log.
This log can be accessed through your GitHub App's settings under the "Advanced" section. See GitHub.com for more information.
Update Instructions
Instructions for updating Pixee Enterprise Server to newer versions.
Dashboard sign-in during an update
If you use embedded authentication with dashboards enabled, this update rotates the
credential the dashboards use to authenticate against the identity provider. Signing
in to dashboards can fail with invalid_client for a minute or two while the
dashboard and identity-provider pods restart. No action is needed — sign-in recovers
on its own once both have restarted. Dashboard data and saved charts are unaffected.
Update Process
To update Pixee Enterprise Server in Embedded Cluster deployments follow:
Updating Pixee Enterprise Server is a simple process:
- Visit the admin console in your browser:
https://<domain name or vm ip>:30000 - Login with the admin console password set during installation
- New available versions will be visible in the
Available Updateslist under theVersion Historytab - Click
deploynext to the desired version you want to upgrade to - Confirm configuration
- Verify preflight checks
- Confirm deployment
To update Pixee Enterprise Server in Helm Deployment follow:
To update a Pixee Enterprise Server release, use the helm upgrade command. This is good for when you need to apply template changes to the running release or update configuration values.
To change variable values in a release, use the helm upgrade command with the -f flag and provide your updated values.yaml file:
helm upgrade pixee-enterprise-server oci://registry.pixee.ai/pixee/stable/pixee-enterprise-server -f values.yaml -n pixee-enterprise-server
If you installed the optional sibling charts (pixee-enterprise-server-docs, pixee-enterprise-server-dashboards), upgrade them separately and to the same chart version — they are version-locked with the main chart and released together:
helm upgrade pixee-enterprise-server-docs oci://registry.pixee.ai/pixee/stable/pixee-enterprise-server-docs -f values.yaml -n pixee-enterprise-server
helm upgrade pixee-enterprise-server-dashboards oci://registry.pixee.ai/pixee/stable/pixee-enterprise-server-dashboards -f values.yaml -n pixee-enterprise-server
AI Providers Overview
This section provides AI provider-specific guidance and resource examples for deploying Pixee Enterprise Server on major cloud platforms.
Advanced AI Model Configuration
Web Search Model
Some analysis tasks need live web search — most notably the Software Composition Analysis (SCA) CVE research agents, which look up advisories and exploit reports while assessing whether a vulnerable dependency is reachable in your code. Those agents request the search tool as a native model capability, so the model you name here has to be one your provider serves search on.
Leaving it blank does not turn web search off. The analysis service keeps the search tool attached to its web search client and only borrows a model name — from the reasoning model in the admin console, or from global.pixee.ai.default.model in a Helm install. If that model serves search natively, research still runs with live search.
Set this field only when research should use a different model from the one handling reasoning.
Provider support. OpenAI, Azure AI Foundry, Anthropic, Azure Anthropic and Bedrock Mantle all serve web search natively. Bedrock Converse does not. The admin console shows no field for it, and a Helm value set for it is ignored rather than passed through — a model named for a role the Converse API cannot serve would fail every research call. On Converse the SCA research agents cannot run at all — the tool is requested as a required native capability, so pydantic-ai raises rather than quietly dropping it.
Navigate to the admin console, select the Config tab, then go to the AI Settings section.
- Web Search Model Name: the model used for research tasks that need live web search. Defaults to the same model as the reasoning field for your provider. Not shown when the provider is Bedrock Converse.
global:
  pixee:
    ai:
      webSearch:
        # Must be a model your provider serves web search on. Leave unset to
        # reuse the default model without the search tool. Ignored entirely
        # when provider is bedrock-converse.
        model: "gpt-5.4-mini"
        # Optional reasoning effort for this model.
        effort: ""
OpenAI
Requirements
AI Provider integration requires:
- An AI provider API key with access to the required models
- An AI provider endpoint, or default to the provider's public API endpoint
- Model names for the reasoning and fast models from your chosen AI provider
For OpenAI, see OpenAI's page on creating an API Key for more information.
OpenAI-compatible APIs
Providers such as Azure AI Foundry and AWS Bedrock provide endpoints for connecting to both OpenAI and non-OpenAI models via a consistent OpenAI-compatible API. This enables connection to models from these providers with the same configuration as if it was OpenAI directly.
Requirements
- An AI provider endpoint
- Model names for the reasoning and fast models from your chosen AI provider
- An AI provider API key with access to the required models
Example: Connecting to DeepSeek-R1 via Azure AI Foundry
Azure AI Foundry hosts a variety of foundation models from industry-leading providers. In this example, Pixee will be configured to connect to DeepSeek-R1 using the OpenAI-compatible API endpoints using the same process for connecting to OpenAI's API directly. This example assumes that the model has already been deployed in the target Azure environment, and a model deployment API key has already been created.
Input the OpenAI-compatible endpoint for your deployment
Azure AI Foundry provides a cononacle URL endpoint for AI Foundry model deployments. It's usually of the format https://{foundary-instance-name}-resource.service.ai.azure.com/models.
Input your API key
Copy the deployment's endpoint key from the Azure AI Foundry portal and paste it into the API key field.
Specify the reasoning and fast model names
Find the DeepSeek-R1 model name in the AI Foundry portal and paste it into the reasoning and fast model name fields. We want to use the same model for this example to keep things simple. But we could choose a different model if we wanted to, so long as it's available in our AI Foundry instance.
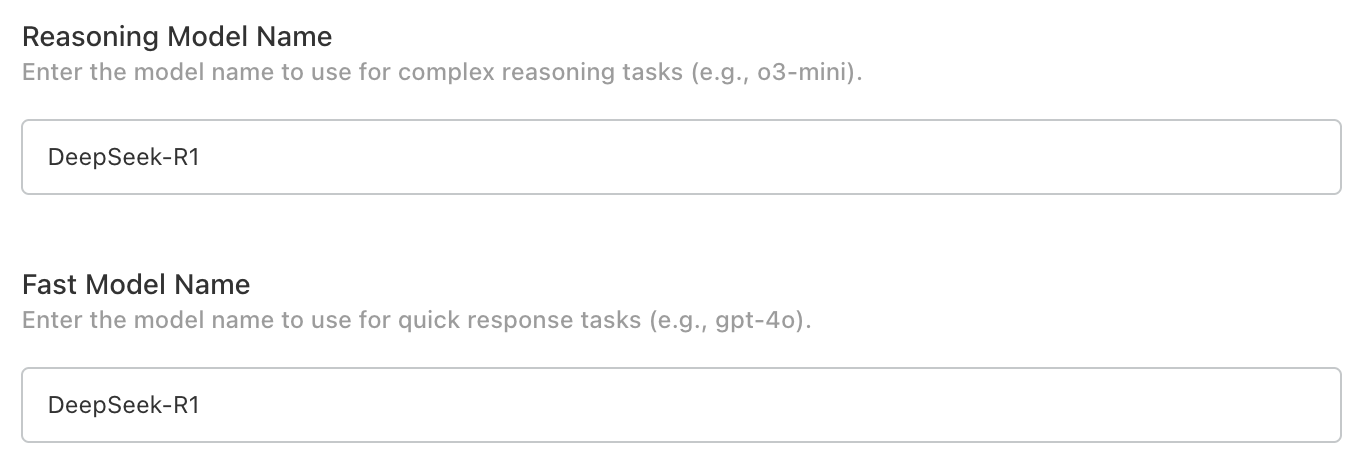
Verify with preflight checks
Preflight checks should run after the configuration is saved and should successfully connect to the model.

Azure OpenAI
Requirements
Azure OpenAI integration requires:
- Integration with Azure OpenAI requires model deployments of the following recommended models:
- gpt-5.4-mini (version: 2026-03-17) -- as fast model
- gpt-5.4-mini (version: 2026-03-17) -- as reasoning model
Databricks AI
Requirements
Databricks AI integration requires:
- Integration with Databricks AI serving endpoints requires:
- Databricks workspace with Mosaic AI Model Serving enabled
- External model endpoints for "gpt-5.4-mini" as fast and reasoning models
- Databricks personal access token with serving endpoint access
Configuration
To integrate Pixee Enterprise Server with Databricks AI serving endpoints:
-
Create the required serving endpoints in Databricks following the Databricks external models documentation. You need to deploy the following endpoint:
gpt-5.4-mini(for gpt-5.4-mini model)
-
Configure Pixee Enterprise Server to use your Databricks workspace URL as the OpenAI base URL with your Databricks PAT as the API key.
-
Verify connectivity by checking that both endpoints are accessible from your Pixee Enterprise Server deployment.
Info
Databricks integration uses the OpenAI-compatible API, so select "OpenAI" as the provider type when configuring through the admin console, and be sure to update the OpenAI Endpoint to match your Databricks base url.
Common Issues
- Ensure your Databricks PAT has permission to access the serving endpoints
- Verify network connectivity between Pixee Enterprise Server and your Databricks workspace
- Check that the required endpoint ("gpt-5.4-mini") is deployed and running
- When using the embedded cluster installation, select "OpenAI" as the provider type since Databricks uses OpenAI-compatible APIs
- Be sure to set the OpenAI endpoint to your Databricks base url
Azure Anthropic
Azure Anthropic allows you to access Anthropic models (such as Claude) through Azure's infrastructure.
Requirements
- An Azure Anthropic API endpoint for your model deployments
- An API key with access to the required models
- Model names for the reasoning and fast models
Configuration
Navigate to the admin console, select the Config tab, then go to the AI Settings section.
Select Azure Anthropic as the Default LLM Provider and configure:
- API Key: Your Azure Anthropic API key
- Endpoint: The Azure Anthropic API endpoint for your model deployments
- Reasoning Model Name: Model for complex reasoning tasks (default: claude-sonnet-4-20250514)
- Fast Model Name: Model for quick response tasks (default: claude-sonnet-4-20250514)
To configure Azure Anthropic in Helm deployments, add the following to your values.yaml:
global:
  pixee:
    ai:
      enabled: true
      default:
        provider: "azure-anthropic"
        model: "claude-sonnet-4-20250514"
        apiKey: "<your Azure Anthropic API key>"
        endpoint: "<your Azure Anthropic endpoint>"
      reasoning:
        model: "claude-sonnet-4-20250514"
      fast:
        model: "claude-sonnet-4-20250514"
AWS Bedrock (Mantle)
AWS Bedrock Mantle serves OpenAI's frontier models (such as GPT-5.6 Luna, Sol, and Terra, and Codex) through an OpenAI-compatible Responses API. These models are reachable only over the Mantle endpoint, not the Bedrock Converse API. Pixee can call Mantle directly or route it through the bundled LiteLLM gateway.
Bedrock offers two incompatible APIs, so the admin console asks for them in two steps: pick AWS Bedrock as the Default LLM Provider, then pick which API to call under Bedrock API. Mantle is the default. Helm deployments skip the second step and name the API directly in the provider value (bedrock-mantle or bedrock-converse).
Upgrading a beta deployment that already ran Bedrock Converse
Earlier builds offered AWS Bedrock (Converse) as its own entry in the Default LLM Provider list. That entry is gone, and the admin console cannot carry the old selection into the new two-step form — the stored value matches nothing, the deployment resolves no provider, and the upgrade fails to deploy with litellm.enabled=true but no upstream provider was resolved.
Before upgrading, or from the admin console afterwards, open AI Settings, choose AWS Bedrock, set Bedrock API to Converse, and save. Your region, API key, and model names are preserved.
This affects only deployments configured on a pre-release build: AWS Bedrock (Converse) has never shipped in a stable release. Helm deployments are unaffected — provider: "bedrock-converse" is unchanged.
Info
Bedrock Mantle hosts OpenAI's proprietary frontier models. Anthropic Claude and other Converse-supported models are reached over the Converse API instead; see AWS Bedrock (Converse) below.
Requirements
- An AWS account with access to the Bedrock Mantle endpoint.
- A Bedrock API key (bearer token).
- A supported region:
us-east-1,us-east-2, orus-west-2. - The model IDs to use, for example
openai.gpt-5.6-luna.
Set up model access in AWS
Do this in AWS before configuring Pixee. The Mantle frontier models are enabled automatically on first use — there is no separate model-access request to approve — and access is controlled entirely through IAM. The simplest way to set everything up is to generate a long-term Bedrock API key, which creates the IAM identity, attaches a Bedrock access policy, and issues the key in a single step.
- Open the Amazon Bedrock console in your chosen region and select API keys.
- On the Long-term API keys tab, choose Generate long-term API keys and set an expiration.
- Under Advanced permissions, add the AWS managed policy
AmazonBedrockMantleInferenceAccess. Mantle models are served on a separate endpoint that the default policy (AmazonBedrockLimitedAccess) does not cover, so this policy is what allows the key to call them. - Generate the key and store it securely — it is shown only once. This is the bearer token you paste into Pixee.
For the full procedure and the AWS CLI equivalent, see AWS's Generate an Amazon Bedrock API key.
Endpoint
The Mantle endpoint is region-specific — the region appears in the hostname, and it must match the region where you generated the API key:
https://bedrock-mantle.<region>.api.aws/openai/v1
| Region | Endpoint |
|---|---|
us-east-1 |
https://bedrock-mantle.us-east-1.api.aws/openai/v1 |
us-east-2 |
https://bedrock-mantle.us-east-2.api.aws/openai/v1 |
us-west-2 |
https://bedrock-mantle.us-west-2.api.aws/openai/v1 |
In the admin console this URL is derived from the AWS Region you enter, so you normally leave Endpoint blank. Helm deployments must set it explicitly.
Configuration
Navigate to the admin console, select the Config tab, then go to the AI Settings section. Select AWS Bedrock as the Default LLM Provider, leave Bedrock API set to Mantle, and configure:
- AWS Region: The region hosting the Mantle endpoint (default:
us-east-1) - API Key: Your AWS Bedrock API key (bearer token)
- Endpoint: Leave blank to use the regional endpoint derived from the AWS Region, or enter a full URL to override it
- Reasoning Model Name: The Mantle model ID for complex reasoning tasks (default:
openai.gpt-5.6-luna) - Fast Model Name: The Mantle model ID for quick response tasks (default:
openai.gpt-5.6-luna)
The Responses API is enabled automatically for this provider, so there is no Use Responses API toggle to set.
Set the Bedrock Mantle provider in your values.yaml. Unlike the admin console, Helm has no region field to derive from, so endpoint is required:
global:
  pixee:
    ai:
      enabled: true
      default:
        provider: "bedrock-mantle"
        # Your AWS Bedrock API key (bearer token).
        apiKey: "<your AWS Bedrock API key>"
        # Required: the region-specific Mantle endpoint.
        endpoint: "https://bedrock-mantle.us-east-1.api.aws/openai/v1"
        # Optional, informational only -- the region is already in the endpoint.
        region: "us-east-1"
        model: "openai.gpt-5.6-luna"
      reasoning:
        model: "openai.gpt-5.6-luna"
      fast:
        model: "openai.gpt-5.6-luna"
Warning
Switching an existing deployment to Bedrock Mantle? Set every model field — reasoning, fast and Web Search Model Name — to a Mantle model ID. openai.gpt-5.6-luna works for all three. These fields keep whatever value your deployment was already using, and OpenAI-hosted names do not exist on Bedrock, so analysis fails until you replace them.
Pick an openai.gpt-5.4, 5.5, or 5.6 model and a region of us-east-1, us-east-2, or us-west-2. Mantle offers web search only on those models in those regions — openai.gpt-5.6-luna qualifies.
Note
Bedrock Mantle works with or without the LiteLLM gateway, but the gateway adds response caching and per-request cost attribution in the LLM Token Usage dashboard, which a direct connection cannot provide.
AWS Bedrock (Converse)
AWS Bedrock lets you run Anthropic Claude models (such as Claude Haiku 4.5) and other foundation models on AWS infrastructure through the Bedrock Converse API. This is the second of the two Bedrock APIs described above — reach it by selecting AWS Bedrock and setting Bedrock API to Converse.
These models are not reachable over the standard OpenAI/Anthropic endpoints, so Pixee routes Converse traffic through its bundled LiteLLM gateway: Pixee's services send ordinary OpenAI chat-completions requests to LiteLLM, and LiteLLM translates each one to the Bedrock Converse API (and the response back to OpenAI shape).
Info
Bedrock Converse is only available through the LiteLLM gateway — the Enable LiteLLM Gateway toggle, on by default, or litellm.enabled: true in Helm.
Warning
Upgrading a beta deployment that already ran Bedrock Converse? The provider list changed shape, your stored selection does not carry over, and the upgrade fails to deploy until you re-select it — see Upgrading a beta deployment that already ran Bedrock Converse above.
Requirements
- The LiteLLM gateway enabled (see the note above)
- An AWS Bedrock API key with model access enabled for the models you intend to use
- The AWS region where those models (or their inference profiles) are enabled
- Model names given as Bedrock inference-profile IDs, e.g.
us.anthropic.claude-haiku-4-5-20251001-v1:0
Warning
Newer Claude models on Bedrock (including Claude Haiku 4.5) can only be invoked through a cross-region inference profile — use the us.-prefixed inference-profile ID (e.g. us.anthropic.claude-haiku-4-5-20251001-v1:0), not the bare anthropic.claude-… model ID, and set the region to a US region where you have model access. The bare ID returns an on-demand-throughput error.
Configuration
Navigate to the admin console, select the Config tab, then go to the AI Settings section. Ensure Enable LiteLLM Gateway is on (it is by default), then select AWS Bedrock as the Default LLM Provider, set Bedrock API to Converse, and configure:
- API Key: Your AWS Bedrock API key (bearer token)
- AWS Region: The region where your Bedrock models are enabled (default:
us-west-2) - Reasoning Model Name: The Bedrock inference-profile ID for complex reasoning tasks (default:
us.anthropic.claude-haiku-4-5-20251001-v1:0) - Fast Model Name: The Bedrock inference-profile ID for quick response tasks (default:
us.anthropic.claude-haiku-4-5-20251001-v1:0)
To configure AWS Bedrock (Converse) in Helm deployments, enable the LiteLLM gateway and set the Bedrock provider in your values.yaml:
litellm:
  enabled: true
  # A LiteLLM master key (the Bearer token in-cluster callers use to reach
  # the gateway). Set a strong random value, or supply litellm.existingSecret.
  masterKey: "<random secret>"
  database:
    # Credentials for LiteLLM's database. Set a strong random value, or
    # supply litellm.database.existingSecret.
    password: "<random secret>"
global:
  pixee:
    ai:
      enabled: true
      default:
        provider: "bedrock-converse"
        # Your AWS Bedrock API key (bearer token). LiteLLM sends it to
        # Bedrock; no AWS access key/secret is required for this method.
        apiKey: "<your AWS Bedrock API key>"
        # The region where your Bedrock models are enabled.
        region: "us-west-2"
        model: "us.anthropic.claude-haiku-4-5-20251001-v1:0"
      reasoning:
        model: "us.anthropic.claude-haiku-4-5-20251001-v1:0"
      fast:
        model: "us.anthropic.claude-haiku-4-5-20251001-v1:0"
Oracle Cloud Infrastructure Generative AI Services
Requirements
Oracle Cloud Infrastructure (OCI) integration requires: - Integration with Oracle Cloud Infrastructure Generative AI Services * Llama and custom models can be deployed, please contact support for up-to-date instructions based on your deployment type. *
Cloud Providers
This section provides cloud provider-specific guidance and resource examples for deploying Pixee Enterprise Server on major cloud platforms.
AWS
Configuration and setup information for deploying Pixee Enterprise Server on Amazon Web Services.
Notes
When installing in EKS v1.30+, persistent volumes need to have the defaultStorageClass set. This is especially important if using the embedded database or embedded object store. Set the following in your values.yaml:
global:
  defaultStorageClass: "gp2"
Resources
For Helm deployments on EKS, AWS resources typically include:
- RDS / Aurora PostgreSQL (small) for external database
- 2x S3 buckets for external object storage
- IAM role with S3 permissions (if using IRSA)
- EKS cluster with appropriate node groups
- Application Load Balancer (if using ALB ingress controller)
Service Account Authentication
For enhanced security when using external object storage, you can configure service account authentication instead of using static AWS credentials. This approach leverages cloud provider IAM roles and eliminates the need for long-lived access keys.
Note
IAM Roles for Service Accounts (IRSA) are currently supported with helm installations. Please reach out to Pixee Support if you need assistance with this setup.
AWS S3 with IRSA (IAM Roles for Service Accounts)
This section covers AWS S3 access from EKS clusters. For other cloud providers accessing their native object stores (GCS, Azure Blob), similar workload identity patterns apply but are not covered in this guide.
Prerequisites
- EKS cluster with OIDC identity provider enabled
- IAM role with appropriate S3 permissions
- Trust relationship configured between the IAM role and the EKS service account
Setup Steps
-
Create IAM Role and Policy
Create an IAM policy with the required S3 permissions:
{ "Version": "2012-10-17", "Statement": [ { "Effect": "Allow", "Action": [ "s3:ListBucket" ], "Resource": [ "arn:aws:s3:::pixee-analysis-input" ] }, { "Effect": "Allow", "Action": [ "s3:GetObject", "s3:PutObject", "s3:DeleteObject", "s3:GetObjectVersion" ], "Resource": [ "arn:aws:s3:::pixee-analysis-input/*" ] } ] } -
Create Kubernetes Service Account
Create a service account with the IAM role annotation:
apiVersion: v1 kind: ServiceAccount metadata: name: pixee-s3-service-account namespace: pixee-enterprise-server annotations: eks.amazonaws.com/role-arn: "arn:aws:iam::123456789012:role/pixee-s3-role" -
Configure Helm Values
Set the following in your
values.yaml:global: pixee: serviceAccount: create: false name: "pixee-s3-service-account" objectStore: embedded: false endpoint: "https://s3.amazonaws.com" region: "us-east-1" credentialType: "default" # Use IRSA # username and password are not required with IRSA
External RDS Database Configuration
If using an external database such as Amazon RDS for PostgreSQL you can reference an existing Kubernetes secret instead of passing the password directly through helm values.
-
See the installation prerequisites for database requirements.
-
Create a Kubernetes secret with a
passwordkey that contains the password for the PostgreSQL user to be used by Pixee. -
Configure Helm Values
database:
  embedded: false
  host: <RDS ENDPOINT>
  port: <RDS PORT>
  name: "pixee_platform"
  username: "pixee"
  existingSecret: <EXISTING SECRET NAME>
Azure
Configuration and setup information for deploying Pixee Enterprise Server on Microsoft Azure.
Resources
For Embedded Cluster deployments on Azure VMs, resources typically include:
- Resource Group (if it doesn't already exist)
- SSH Key (stored in Azure; used by the VM)
- Virtual Network (VNet)
- Subnet (within the VNet)
- Network Security Group (NSG)
- Inbound rule for TCP on ports: 30000, 443, and 22, 80 temporarily
- Public IP Address (Standard, static)
- Network Interface (NIC) (linked to VNet, subnet, NSG, and the public IP)
- Optional: Azure DNS Zone (if you provide a domain)
- DNS A record pointing to the public IP
- Virtual Machine (image: Canonical:0001-com-ubuntu-server-jammy:22_04-lts-gen2:latest, attached to the resources above)
- Size: Standard_D8s_v3 w/ 512 GB, Premium_LRS os disk
- Azure Cognitive Services (OpenAI) resource
- OpenAI Model Deployment ("gpt-5.4-mini")
For Helm deployments on AKS, Azure resources typically include:
- Resource Group (if it doesn't already exist)
- Virtual Network (VNet)
- Subnet (within the VNet)
- Network Security Group (NSG)
- Inbound rule for TCP on ports: 443
- Public IP Address (Standard, static)
- Optional: Azure DNS Zone (if you provide a domain)
- DNS A record pointing to the public IP
- Kubernetes cluster (AKS) with worker nodes sized appropriately
- Node size equivalent to Standard_D8s_v3 or better
- Azure Cognitive Services (OpenAI) resource
- OpenAI Model Deployment ("gpt-5.4-mini")
Google Cloud Platform
Configuration and setup information for deploying Pixee Enterprise Server on Google Cloud Platform.
Notes
You can utilize the built-in ingress controller for Google Kubernetes Engine by setting the following in values.yaml:
global:
platform:
  service:
    type: ClusterIP
  ingress:
    enabled: true
    className: "gce"
    annotations:
      "kubernetes.io/ingress.class": "gce"
    hosts:
      - host: ""
        paths:
          - path: "/"
            pathType: "Prefix"
Resources
For Helm deployments on GKE, Google Cloud resources typically include:
- Google Kubernetes Engine
- Cloud SQL
Oracle Cloud Infrastructure
Configuration and setup information for deploying Pixee Enterprise Server on Oracle Cloud Infrastructure.
Resources
For Embedded Cluster deployments on OCI VMs, resources typically include:
- Virtual Cloud Network (VCN)
- Subnet (within the VCN)
- Network Security Group (NSG)
- Security List or NSG Rules (allowing ingress on ports 30000, 443, 22 (temp), 80 (temp))
- Reserved Public IP (if applicable)
- Virtual Network Interface Card (VNIC) (attached to the instance, associated with VCN, subnet, NSG, and Public IP)
- OCI DNS Zone (if managing the domain in OCI)
- DNS A Record (pointing to the Reserved Public IP in OCI DNS)
- Compute Instance (Ubuntu 22.04 image from OCI Marketplace or Platform Images)
- VM.Standard3.Flex (8 OCPUs, 64GB RAM) with a 512 GB Block Volume (NVMe or Balanced option)
- SSH Key Pair
- OCI Generative AI (if available) or Custom Model Deployment in OCI Data Science
- OCI Generative AI Service Deployment (if applicable) or OCI AI Services (custom model in Data Science or AI Text Services)
For Helm deployments on OKE, OCI resources typically include:
- Virtual Cloud Network (VCN)
- Subnet (within the VCN)
- Network Security Group (NSG)
- Security List or NSG Rules (allowing ingress on ports 443)
- Reserved Public IP (if applicable)
- OCI DNS Zone (if managing the domain in OCI)
- DNS A Record (pointing to the Reserved Public IP in OCI DNS)
- Kubernetes cluster (OKE) with worker nodes sized appropriately
- Node size equivalent to VM.Standard3.Flex (8 OCPUs, 64GB RAM)
- OCI Generative AI (if available) or Custom Model Deployment in OCI Data Science
- OCI Generative AI Service Deployment (if applicable) or OCI AI Services (custom model in Data Science or AI Text Services)
Organization Preferences
Organization preferences let you define natural-language guidelines that Pixee applies across all repositories in your organization. Instead of configuring each repository individually, you can set baseline rules once and have them take effect everywhere.
Accessing Preferences
Select your organization from the top bar in the Pixee Platform UI, then navigate to Preferences. The preferences editor supports Markdown formatting and saves your changes immediately.
Writing Preferences
Write your preferences in Markdown. Pixee interprets the document with AI, so plain prose works well — you don't need to follow a rigid schema. Be specific, show code where you can, and explain why a preference exists. That context is what lets Pixee apply your guidance correctly to new findings.
Preferences influence two stages of analysis:
- Triage — whether a finding is a real risk in your environment.
- Remediation — how Pixee should fix a vulnerability when it does generate a fix.
You can also use preferences to enable or disable specific scanner rules for automated remediation.
Remediation guidance
Tell Pixee how your team prefers to fix specific vulnerability classes — approved libraries, internal utilities, idiomatic patterns. Code examples are the clearest signal.
## SQL Injection

When fixing SQL injection vulnerabilities, use Spring's
`NamedParameterJdbcTemplate` with named parameters (`:paramName`)
rather than positional placeholders (`?`). This is our team
standard and `spring-jdbc` is already on the classpath.

**Preferred:**
```java
NamedParameterJdbcTemplate jdbc = new NamedParameterJdbcTemplate(dataSource);
String sql = "SELECT * FROM users WHERE email = :email";
MapSqlParameterSource params = new MapSqlParameterSource("email", email);
return jdbc.query(sql, params, rowMapper);
## Cross-Site Scripting

For XSS in user-generated content, use `DOMPurify` for HTML
sanitization. Our editors need safe HTML formatting preserved,
so escaping alone isn't sufficient. Add `dompurify` and `jsdom`
to `package.json` if not already present.

**Preferred:**
```javascript
const purify = DOMPurify(new JSDOM('').window);
return purify.sanitize(html, {
    ALLOWED_TAGS: ['p', 'br', 'strong', 'em', 'ul', 'ol', 'li', 'a'],
    ALLOWED_ATTR: ['href', 'class']
});
## Path Traversal

Use the internal `PathValidatorUtility` from
`DocumentManagement.Security` for any filesystem path that
incorporates user input. It has been audited by our security
team and enforces consistent path policy across services.

**Preferred:**
```csharp
string safePath = PathValidatorUtility.ValidatePathForRead(filename);
byte[] bytes = System.IO.File.ReadAllBytes(safePath);
Triage context
Give Pixee context about your deployment environment, compensating controls, or intentional patterns so it can decide whether a finding is a real risk in your code.
## Service Context

This is an internal microservice that is not exposed to the
internet. It runs behind our API gateway, which handles
authentication (OAuth 2.0 + JWT), rate limiting, request size
limits, and TLS termination. All callers are other internal
services using service accounts.

Findings about missing authentication, CSRF protection, or
request size validation at the controller level are lower
risk because those controls live at the infrastructure layer.
## SSRF Context

For SOC2 compliance, this application only makes outbound HTTP
requests to a fixed allowlist of pre-approved endpoints:

- `https://api.github.com/repos/`
- `https://hooks.slack.com/services/`
- `https://api.stripe.com/v1/`

Outbound URLs are validated against this allowlist at the
application layer before any request is made. URLs that do
not match an approved prefix are rejected.
## Cryptography Context

This service uses MD5 in two places, both intentional and
non-security-sensitive:

1. `src/cache/key_generator.py` — generating cache keys from
   request parameters. Collision resistance is not required.
2. `src/legacy/checksum.py` — verifying file integrity against
   checksums supplied by a third-party vendor that only
   provides MD5.

Findings about weak hashing in these files are expected. MD5
is not used for passwords, signatures, or authentication.
Enabling and disabling rules
You can tell Pixee to always remediate or never remediate specific scanner rules. Reference rules by tool name and rule ID for the best match.
## Rule Preferences

### Always fix
- Enable Sonar rule S2077 (SQL injection) — always remediate, even
  if triage might otherwise skip it.
- Enable CodeQL rule `javascript/sql-injection` for all SQL injection
  findings.

### Never auto-fix
- Disable CodeQL rule `java/hardcoded-credential` — we manage secrets
  through our vault integration; the "hardcoded" values are vault
  references resolved at deploy time.
Supported scanners include Sonar, CodeQL, Semgrep, Checkmarx, Snyk, GitLab SAST, Veracode, AppScan, Polaris, Trivy, Datadog SAST, and Fortify.
Tip
Start with a few high-impact rules and refine them over time. You can review how Pixee applies your preferences in the activity log for each repository.
When you first open the preferences editor, you'll see example content to help you get started. Replace it with rules tailored to your organization's standards and workflows.
How Preferences Are Applied
Pixee uses a single source of preferences for each analysis run. The following precedence rules determine which source is used:
- Repo-level
PIXEE.mdtakes priority when present. If a repository contains aPIXEE.mdfile, Pixee uses it and ignores organization preferences for that repository. - Organization preferences serve as the baseline for any repository that does not have its own
PIXEE.md. - Empty
PIXEE.mdopts a repository out of organization preferences entirely. If you want a repository to have no preferences at all, commit an emptyPIXEE.mdfile.
Info
There is no merging between sources. Pixee uses either the repo-level PIXEE.md or the organization preferences — never both. If you have requirements for merging preferences from multiple sources, please contact Pixee support.
Concurrent Editing
Organization preferences use optimistic locking to prevent silent overwrites. If another user saves changes while you are editing, you will see a conflict warning when you attempt to save. When this happens, refresh the page to load the latest version before making your changes again.
Observability
Observability
Pixee Enterprise Server provides comprehensive observability tools to help you monitor and understand your deployment's behavior.
Available Tools
Metrics & Dashboards
Monitor real-time metrics and visualize system performance with custom dashboards. Track AI service performance, per-finding task metrics, and more.
Logs & Debugging
Access pod status, view application logs, and query centralized logs with VictoriaLogs. When local metrics is enabled, logs from all Pixee components are automatically collected and searchable via the VictoriaLogs VMUI.
Learn more about Logs & Debugging →
Pod Log Storage
Understand where kubelet writes container output on disk, why that placement decides whether a runaway container can fill a volume unnoticed, and how to relocate it — at install time or on a running cluster.
Learn more about Pod Log Storage →
Traces
Inspect distributed traces from the analysis service with VictoriaTraces. When local metrics is enabled, trace telemetry is automatically collected, allowing you to search by service name, trace ID, or span attributes.
Programmatic Access with the Pixee CLI
The metrics, logs, and traces backends are also reachable over HTTP under the /o11y/ path, protected by your deployment's built-in identity provider (Authentik). The Pixee CLI authenticates you and mints a short-lived, per-user token so you can query observability data from scripts or a coding agent — no shared API key to manage.
Authenticate once per deployment using the OAuth2 device flow:
pixee auth login --server https://pixee.example.com
This opens your browser to sign in through your identity provider, then caches an access token and refresh token locally (file permissions 0600). Retrieve a currently-valid bearer token at any time — it refreshes automatically — and pass it to the observability HTTP APIs:
TOKEN=$(pixee auth token --server https://pixee.example.com)

# Logs (VictoriaLogs / LogsQL)
curl -sG -H "Authorization: Bearer $TOKEN" \
  https://pixee.example.com/o11y/logs/select/logsql/query \
  --data-urlencode 'query=_time:1h | limit 100'

# Metrics (VictoriaMetrics / PromQL)
curl -sG -H "Authorization: Bearer $TOKEN" \
  https://pixee.example.com/o11y/metrics/prometheus/api/v1/query \
  --data-urlencode 'query=up'

# Traces (VictoriaTraces / Jaeger API)
curl -s -H "Authorization: Bearer $TOKEN" \
  https://pixee.example.com/o11y/traces/select/jaeger/api/services
Use pixee auth status to check your session and pixee auth logout to clear it. Because authentication goes through your identity provider, each person queries as themselves and access is governed by your existing IdP policies.
Note
Programmatic observability access requires the observability stack (local metrics) to be enabled on your deployment — see Enabling Local Metrics. --server may be omitted once you have logged in, in which case the stored server is used.
Getting Started
For most operational tasks, you'll need:
kubectlaccess to your cluster- SSH access to the cluster host (for Embedded Cluster deployments)
- Knowledge of your deployment namespace:
- Embedded Cluster:
kotsadm - Helm Deployment:
pixee-enterprise-server
- Embedded Cluster:
Logs & Debugging
Access pod status, view application logs, and query centralized logs for your Pixee Enterprise Server deployment.
VictoriaLogs (Centralized Logging)
When local metrics is enabled, Pixee Enterprise Server also deploys VictoriaLogs for centralized log collection. VictoriaLogs automatically collects and indexes logs from all Pixee components, making it easy to search and analyze logs across your entire deployment.
Enabling VictoriaLogs
VictoriaLogs is automatically enabled when you enable local metrics. See Enabling Local Metrics for instructions.
Accessing VictoriaLogs VMUI
You can access the VictoriaLogs web interface to query and explore logs. You can either enable web access via ingress or use port forwarding.
Option 1: Enable VMUI Web Interface (Ingress)
Enable the VMUI web interface to access the logs query interface directly through your browser.
To enable the VictoriaLogs web interface in Embedded Cluster deployments:
- Navigate to the admin console
- Select the
Configtab - Go to the
Advanced Settingssection - Check the
Enable VMUI web interfaceoption (this enables both metrics and logs interfaces) - Save and redeploy the application
Once enabled, access the logs interface at:
https://<your-domain>/logs/vmui/
Unauthenticated Access
The VMUI web interface endpoints are not authenticated. Only enable this option if your deployment is within a trusted network or you have implemented external authentication.
To enable the VictoriaLogs web interface in Helm Deployment, add the following to your values.yaml:
victoria-logs-single:
  server:
    ingress:
      enabled: true
      ingressClassName: "nginx"  # Use your ingress class
      hosts:
        - name: "your-domain.com"
          path:
            - /logs
          port: http
Then upgrade your deployment:
helm upgrade pixee-enterprise-server ./charts/pixee-enterprise-server \
  -f values.yaml \
  -n pixee-enterprise-server
Once enabled, access the logs interface at:
https://your-domain.com/logs/vmui/
Unauthenticated Access
The VMUI web interface endpoints are not authenticated. Consider implementing external authentication or only enable this in trusted network environments.
Option 2: Port Forwarding
If you prefer not to expose the VMUI via ingress, you can use port forwarding for temporary access.
Step 1: Create SSH tunnel from your local machine
ssh -L 9428:localhost:9428 pixee@<your-hostname>
Step 2: Set up port forwarding
In the SSH session, run:
sudo ./pixee shell
kubectl -n kotsadm port-forward pixee-enterprise-server-logs-server-0 9428:9428
Step 3: Access the logs interface
Open your browser and navigate to:
http://localhost:9428/logs/select/vmui/
Step 1: Port forward to VictoriaLogs
kubectl port-forward svc/pixee-enterprise-server-victoria-logs-single-server 9428:9428 -n pixee-enterprise-server
Step 2: Access the logs interface
Open your browser and navigate to:
http://localhost:9428/logs/select/vmui/
LogsQL Query Examples
VictoriaLogs uses LogsQL, a powerful query language for searching and filtering logs. Here are some useful queries:
# Search for errors across all logs
error OR ERROR

# Filter logs by pod name (pod names carry a generated suffix, so match a prefix)
_stream:{kubernetes.pod_name=~"pixee-enterprise-server-platform.*"}

# Search for specific text in platform logs
_stream:{kubernetes.pod_name=~"pixee-enterprise-server-platform.*"} AND "webhook"

# Find logs with a specific log level
_stream:{kubernetes.pod_name=~"pixee-enterprise-server-.*"} AND level:"ERROR"

# Search within a time range (use the time picker in VMUI)
_stream:{kubernetes.pod_namespace="kotsadm"} AND "analysis"
VictoriaLogs Resources
- VictoriaLogs Documentation
- LogsQL Query Language - Complete LogsQL reference
- VictoriaLogs VMUI - Web UI guide for logs
Viewing Pods
To view the pods in your deployment, use the namespace you installed Pixee into:
- Embedded Cluster:
kotsadm - Helm Deployment:
pixee-enterprise-server,default, or your selected namespace
List Running Pods
kubectl get pods -n <namespace> --field-selector status.phase=Running
View All Pods with Status
kubectl get pods -n <namespace>
Viewing Logs
Basic Log Viewing
To view logs for a specific service, use the kubectl logs command. For example, to view logs for the platform service:
kubectl logs deployment.apps/pixee-enterprise-server-platform -n kotsadm
kubectl logs deployment.apps/pixee-enterprise-server-platform -n pixee-enterprise-server
Viewing Recent Logs
To narrow down to the last 25 lines with timestamps:
kubectl logs deployment.apps/pixee-enterprise-server-platform -n kotsadm --tail 25 --timestamps
kubectl logs deployment.apps/pixee-enterprise-server-platform -n pixee-enterprise-server --tail 25 --timestamps
Following Logs in Real-Time
To continuously stream new logs as they are generated, use the --follow flag:
kubectl logs deployment.apps/pixee-enterprise-server-platform -n kotsadm --follow --tail 25 --timestamps
kubectl logs deployment.apps/pixee-enterprise-server-platform -n pixee-enterprise-server --follow --tail 25 --timestamps
Common Deployments to Monitor
Here are the main Pixee Enterprise Server deployments you may need to view logs for:
| Deployment | Purpose |
|---|---|
pixee-enterprise-server-platform |
Main platform service |
pixee-enterprise-server-analysis |
Analysis service |
Example: Viewing Analysis Service Logs
kubectl logs deployment.apps/pixee-enterprise-server-analysis -n kotsadm --tail 50 --timestamps
kubectl logs deployment.apps/pixee-enterprise-server-analysis -n pixee-enterprise-server --tail 50 --timestamps
Viewing Logs for Specific Pods
If you need to view logs for a specific pod (rather than a service), first get the pod name:
kubectl get pods -n <namespace>
Then view the logs:
kubectl logs <pod-name> -n <namespace>
Multiple Containers in a Pod
If a pod has multiple containers, specify the container name:
kubectl logs <pod-name> -c <container-name> -n <namespace>
Troubleshooting Common Issues
No Logs Appearing
If no logs are appearing:
-
Verify the pod is running:
kubectl get pods -n <namespace> -
Check pod status and events:
kubectl describe pod <pod-name> -n <namespace> -
Check if the service has active endpoints:
kubectl get endpoints -n <namespace>
Pod Keeps Restarting
If a pod is repeatedly restarting, check the previous container's logs:
kubectl logs <pod-name> -n <namespace> --previous
Debugging an Outbound Integration
When the platform cannot reach an integration — Azure DevOps, Bitbucket, GitLab, Sonar, Checkmarx,
Veracode, AppScan and the rest — and the ordinary logs say only that the call failed, the admin
console's Include HTTP wire logs option (Support Bundle settings) raises the platform's Apache
HttpClient header and wire loggers to DEBUG, so the request and response detail is recorded.
These loggers apply no redaction
The header logger prints every header verbatim, so an authenticated request records its
Authorization: Bearer … header in plain text; the wire logger additionally records full
request and response bodies, which is where credentials submitted in a payload — an AppScan
API-key login, for example — end up. Credentials captured this way have previously reached a
support bundle that was then shared onward.
Enable the option only on a non-production install, turn it off as soon as you have reproduced the problem, and rotate anything it logged before sharing a bundle.
Include noisy logs is a separate option and deliberately does not raise these loggers, so turning it on never exposes credentials.
Querying Logs Programmatically
Beyond the VictoriaLogs VMUI, you can query logs over HTTP with the Pixee CLI, which authenticates you through your identity provider and supplies a per-user bearer token:
TOKEN=$(pixee auth token --server https://pixee.example.com)
curl -sG -H "Authorization: Bearer $TOKEN" \
  https://pixee.example.com/o11y/logs/select/logsql/query \
  --data-urlencode 'query=_time:1h kubernetes.pod_namespace="pixee-enterprise-server" | limit 100'
The query parameter uses LogsQL, VictoriaLogs' query language — see the LogsQL reference for the full syntax (time filters, stream selectors, pipes, and stats).
See Programmatic Access with the Pixee CLI for the one-time pixee auth login step.
Additional Resources
For more information on the kubectl logs command, see the Kubernetes documentation.
Metrics & Dashboards
Pixee Enterprise Server includes Victoria Metrics for local metrics collection and visualization. Pre-configured dashboards are automatically deployed to help monitor host and per-workload resource usage, the platform and analysis services (including AI service and per-finding task metrics), and the shared PostgreSQL database.
Enabling Local Metrics
Before accessing Metrics dashboards, you must enable local metrics collection in your deployment.
To enable local metrics collection in Embedded Cluster deployments:
- Navigate to the admin console
- Select the
Configtab - Go to the
Advanced Settingssection - Check the
Enable Local Metricsoption - Save and redeploy the application
To enable local metrics collection in Helm Deployment, add the following to your values.yaml:
global:
  pixee:
    localMetrics:
      enabled: true
Then upgrade your deployment:
helm upgrade pixee-enterprise-server ./charts/pixee-enterprise-server \
  -f values.yaml \
  -n pixee-enterprise-server
Accessing Metrics Dashboards
After enabling local metrics, you can access the Metrics dashboards to view real-time metrics and custom dashboards. You can either enable web access via ingress or use port forwarding.
Option 1: Enable VMUI Web Interface (Ingress)
Enable the VMUI web interface to access metrics dashboards directly through your browser without port forwarding.
To enable the VMUI web interface in Embedded Cluster deployments:
- Navigate to the admin console
- Select the
Configtab - Go to the
Advanced Settingssection - Check the
Enable VMUI web interfaceoption - Save and redeploy the application
Once enabled, access the dashboards at:
https://<your-domain>/metrics/vmui/#/dashboards
Unauthenticated Access
The VMUI web interface endpoints are not authenticated. Only enable this option if your deployment is within a trusted network or you have implemented external authentication.
To enable the VMUI web interface in Helm Deployment, add the following to your values.yaml:
victoria-metrics-single:
  server:
    ingress:
      enabled: true
      ingressClassName: "nginx"  # Use your ingress class
      hosts:
        - name: "your-domain.com"
          path:
            - /metrics
          port: http
Then upgrade your deployment:
helm upgrade pixee-enterprise-server ./charts/pixee-enterprise-server \
  -f values.yaml \
  -n pixee-enterprise-server
Once enabled, access the dashboards at:
https://your-domain.com/metrics/vmui/#/dashboards
Unauthenticated Access
The VMUI web interface endpoints are not authenticated. Consider implementing external authentication or only enable this in trusted network environments.
Option 2: Port Forwarding
If you prefer not to expose the VMUI via ingress, you can use port forwarding for temporary access.
Step 1: Create SSH tunnel from your local machine
ssh -L 8428:localhost:8428 pixee@<your-hostname>
Step 2: Set up port forwarding
In the SSH session, run:
sudo ./pixee shell
kubectl -n kotsadm port-forward pixee-enterprise-server-metrics-server-0 8428:8428
Step 3: Access the dashboards
Open your browser and navigate to:
http://localhost:8428/metrics/vmui/#/dashboards
Tip
Keep the SSH tunnel and port-forward running while viewing the dashboards.
Step 1: Port forward to Metrics
kubectl port-forward pixee-enterprise-server-metrics-server-0 8428:8428 -n pixee-enterprise-server
Step 2: Access the dashboards
Open your browser and navigate to:
http://localhost:8428/metrics/vmui/#/dashboards
Available Dashboards
Pixee Enterprise Server ships five pre-configured dashboards, organized by service and by shared infrastructure. Each opens with all of its panels expanded. The Alerts dashboard appears only when alerting is enabled, since its panels read a series that does not exist otherwise.
System
Cluster and host resource usage across the Pixee deployment:
- CPU / Memory Utilization (host): overall node CPU and memory usage
- CPU cores used (top 15 workloads) and Memory working set (top 15 workloads): per-workload resource usage, scoped to Pixee's own workloads
- Top pods by CPU throttled ratio: pods that are hitting their CPU limits (CFS throttling)
- Top pods by memory
Platform
The platform service:
- Container resources: CPU cores used, CPU throttled ratio, configured CPU limit, and memory working set for the platform pods
- JVM: heap and non-heap memory, garbage collection and allocation, threads, and classes
- HTTP: active requests and request latency
- JDBC Pool (HikariCP): connection pool activity, sizing, acquire/creation times, and timeouts
Analysis
The analysis service, including AI service and per-finding task metrics:
- Container resources: CPU cores used, CPU throttled ratio, configured CPU limit, and memory working set for the analysis pods
- AI Service Requests Rate: request volume by model, status, and status code
- AI Service Latency Percentiles: p50, p95, and p99 latency by model and status
- AI Service Retry Rate: retry frequency across services
- AI Service Rate Limit Events: rate limiting occurrences
- AI Health Check Latency Percentiles: health check performance (p50, p95, p99)
- Per-Finding Task Counts by Type and Status: task distribution and completion rates
- Token Usage p50 by Task Type and Model: median token consumption per task type and model
Database
PostgreSQL (CloudNativePG), shared by every service:
- Connections: backends by database and state, backends waiting on locks, max transaction duration, and total backends
- Storage & WAL: database size, write-ahead log (WAL) size on disk, and WAL generation rate
- Health: Postgres up and last-collection-error status
Example: Troubleshooting Analysis Latency
One of the most common use cases for the metrics dashboards is troubleshooting slow analysis performance. The AI Service Latency Percentiles panel — in the Analysis dashboard — is particularly useful for identifying which AI models are contributing to latency issues.
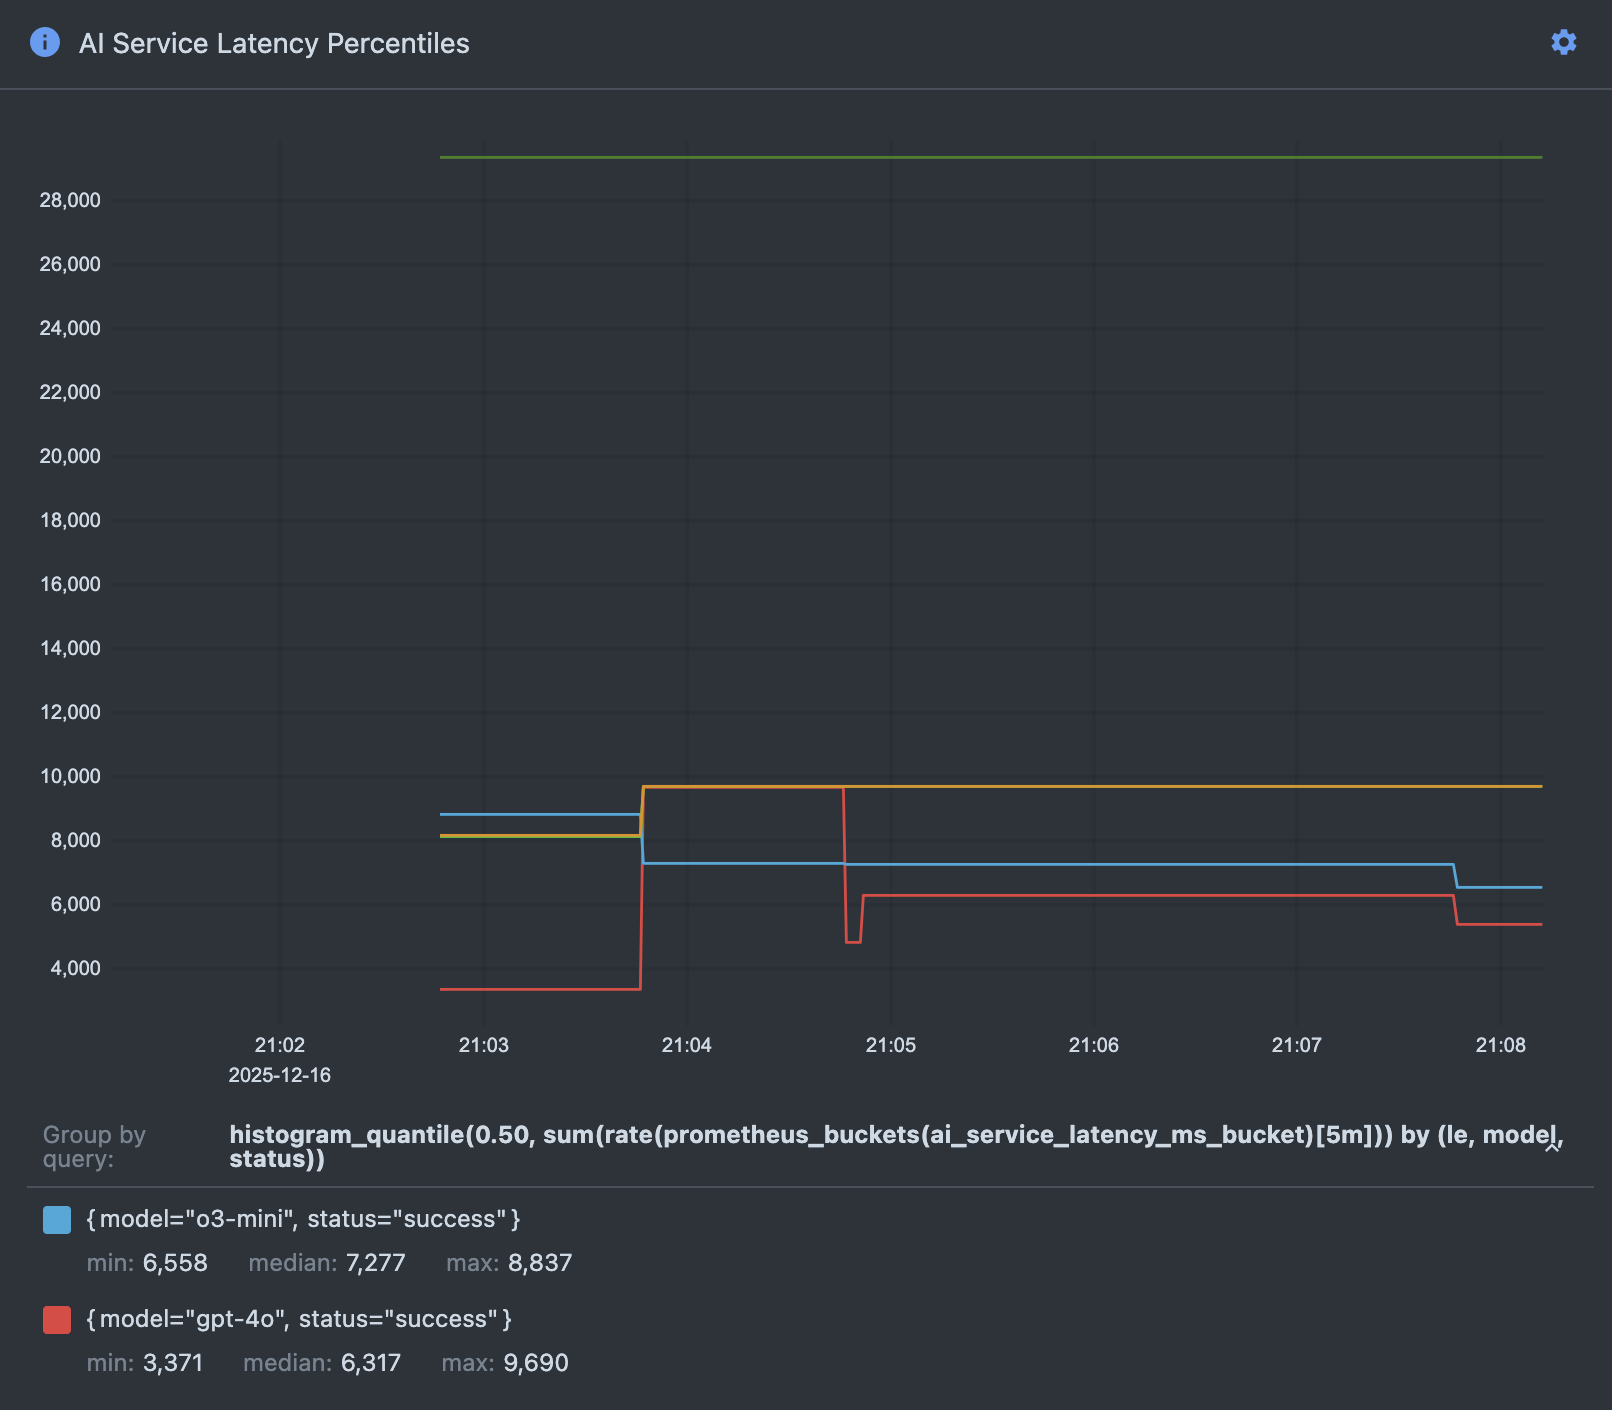
Understanding the Latency Percentiles Graph
The AI Service Latency Percentiles panel displays three key metrics for each AI model over time:
- p50 (Median): The median latency - half of all requests complete faster than this value, half complete slower. This represents typical performance.
- p95: 95% of requests complete faster than this value. This helps identify performance outliers while filtering out the worst 5%.
- p99 (Maximum): 99% of requests complete faster than this value. This captures near-worst-case performance and helps identify extreme latency spikes.
Each AI model (e.g., gpt-5.4-mini) has its own set of percentile lines on the graph, allowing you to compare performance across models and identify which models are experiencing latency issues.
Troubleshooting Scenario
If users report that analysis is taking longer than expected:
-
Open the Analysis dashboard and find the AI Service Latency Percentiles panel, following the steps in Accessing Metrics Dashboards
-
Identify the time period when the slowdown occurred using the time range selector in VMUI
-
Compare latency across models:
- Look for models with elevated p50 values - this indicates consistently slow performance
- Check for spikes in p95 or p99 values - this indicates intermittent latency issues
-
Compare current latency values to historical baselines to confirm degradation
-
Correlate with other metrics:
- Check the AI Service Requests Rate dashboard to see if increased request volume is causing the latency
- Review the AI Service Rate Limit Events dashboard to see if rate limiting is delaying requests
-
Examine the AI Service Retry Rate to identify if failed requests are causing delays
-
Take action based on findings:
- If a specific model shows consistently high latency, consider switching to an alternative model or contacting the AI service provider
- If rate limiting is occurring, adjust request rates or increase service quotas
- If all models show elevated latency during specific time periods, investigate external factors (network issues, AI service outages, etc.)
Dashboard Updates
Dashboards reload automatically
When dashboards are added or updated during an upgrade, Victoria Metrics reloads them from its mounted configuration automatically — no pod restart is required. Just refresh the VMUI page; the change appears within a minute or so.
If updated dashboards still don't appear, you can force a reload by restarting the Metrics pod:
# For Embedded Cluster
kubectl rollout restart statefulset pixee-enterprise-server-metrics-server -n kotsadm

# For Helm Deployment
kubectl rollout restart statefulset pixee-enterprise-server-metrics-server -n pixee-enterprise-server
Monitor the restart progress:
# For Embedded Cluster
kubectl rollout status statefulset pixee-enterprise-server-metrics-server -n kotsadm

# For Helm Deployment
kubectl rollout status statefulset pixee-enterprise-server-metrics-server -n pixee-enterprise-server
User-Created Dashboards Are Not Persisted
Custom dashboards created through the Metrics UI are stored in browser localStorage and are not persisted to the cluster. They will be lost when:
- The pod restarts
- You clear your browser cache
- You access Metrics from a different browser or device
To preserve custom dashboards:
- Export them as JSON files before pod restarts
- Save the JSON files to your local filesystem
- Re-import them after the pod restart
Victoria Metrics VMUI
Victoria Metrics provides a powerful UI (VMUI) for querying and visualizing metrics beyond the pre-configured dashboards.
Accessing VMUI
Access the full VMUI interface at:
http://localhost:8428/metrics/vmui/
VMUI Features
From the VMUI, you can:
- Execute PromQL queries: Write custom queries to explore your metrics
- Create custom visualizations: Build charts and graphs for any metric
- Explore available metrics: Browse all collected metrics and their labels
- View and create dashboards: Access pre-configured dashboards or create your own
- Export data: Download metrics data for offline analysis
Useful PromQL Queries
Here are some example queries you can run in VMUI:
# View all metric names
{__name__!=""}

# AI service request rate (last 5 minutes)
rate(ai_service_requests[5m])

# AI service latency by model
histogram_quantile(0.95, sum(rate(ai_service_latency_ms_bucket[5m])) by (le, model))

# Per-finding task counts by status
sum by(status) (per_finding_tasks)
Metrics Retention
Metrics are retained for 3 days by default. This retention period balances observability needs with storage requirements.
Adjusting Retention Period
To adjust the retention period in Embedded Cluster deployments:
- Navigate to the admin console
- Select the
Configtab - Go to the
Advanced Settingssection - Update the
Metrics retention periodfield (e.g., 3d, 7d, 30d, 1y) - Save and redeploy the application
The new retention period will be applied automatically during the deployment.
To adjust the retention period in Helm Deployment, add the following to your values.yaml:
victoria-metrics-single:
  server:
    retentionPeriod: "7d"  # Options: 3d, 7d, 30d, 1y, etc.
Then upgrade your deployment:
helm upgrade pixee-enterprise-server ./charts/pixee-enterprise-server \
  -f values.yaml \
  -n pixee-enterprise-server
The new retention period will be applied automatically during the deployment.
Troubleshooting
Port Forward Fails
If port forwarding fails, verify the pod is running:
# For Embedded Cluster
kubectl get pod pixee-enterprise-server-metrics-server-0 -n kotsadm

# For Helm Deployment
kubectl get pod pixee-enterprise-server-metrics-server-0 -n pixee-enterprise-server
If the pod is not running, check the pod logs:
# For Embedded Cluster
kubectl logs pixee-enterprise-server-metrics-server-0 -n kotsadm

# For Helm Deployment
kubectl logs pixee-enterprise-server-metrics-server-0 -n pixee-enterprise-server
Dashboards Not Appearing
If dashboards don't appear after an upgrade:
- Verify local metrics is enabled (see Enabling Local Metrics)
- Restart the Metrics pod (see Dashboard Updates)
- Clear your browser cache and refresh the page
- Check that you're accessing the correct URL:
http://localhost:8428/metrics/vmui/#/dashboards
No Metrics Data
If dashboards show no data:
- Verify local metrics has been enabled for at least a few minutes (metrics need time to accumulate)
- Ensure you have run at least one Pixee analysis to generate metrics data (trigger a repository scan, PR analysis, or other Pixee operation)
- Check that the analysis and platform services are running and processing work
- Verify the time range selector in VMUI is set appropriately (default is "Last 30 minutes")
Querying Metrics Programmatically
Beyond the VMUI, you can query metrics over HTTP with the Pixee CLI, which authenticates you through your identity provider and supplies a per-user bearer token:
TOKEN=$(pixee auth token --server https://pixee.example.com)
curl -sG -H "Authorization: Bearer $TOKEN" \
  https://pixee.example.com/o11y/metrics/prometheus/api/v1/query \
  --data-urlencode 'query=up'
See Programmatic Access with the Pixee CLI for the one-time pixee auth login step.
Additional Resources
- VictoriaMetrics Documentation
- MetricsQL Query Language - VictoriaMetrics query language (PromQL-compatible with extensions)
- VMUI Documentation - VictoriaMetrics web UI guide
- PromQL Query Examples
Alerting
Pixee Enterprise Server can evaluate threshold rules against the metrics VictoriaMetrics already stores and notify you when one fires. Alerting adds no new scrape jobs, since the data is already being collected. The only cost is the two small components that evaluate and route it, vmalert and Alertmanager.
Alerting requires local metrics, which are its data source. With metrics off there is nothing to evaluate, and the option is hidden.
Enabling Alerting
- Navigate to the admin console
- Select the
Configtab - Go to the
Advanced Settingssection - Ensure
Enable Local Metricsis checked - Check the
Local alertingoption - Save and redeploy the application
Alerting lives in the pixee-enterprise-server-observability chart. Add the following to that chart's values.yaml:
victoriametrics:
  enabled: true
vmalert:
  enabled: true
The main chart needs to know alerting is running so its support-bundle collectors wire themselves up. In the pixee-enterprise-server chart's values:
global:
  pixee:
    observability:
      alertsEnabled: true
Delivery
Slack and email are both optional and independent. Configure either, both, or neither.
With neither configured, alerting still works. Alertmanager groups and displays every firing alert in its web interface, and silences still function. Delivery is an addition on top of that, not a prerequisite.
Supply a Slack incoming-webhook URL. A webhook is already bound to a single channel, so there is nothing else to configure. Alertmanager posts wherever the webhook points.
Requires outbound network access to Slack. On an air-gapped install, use email or the web interfaces instead.
Email reuses the SMTP server already configured for Authentik account recovery, so only the recipient address is alert-specific. The option appears once SMTP is enabled.
An SMTP encryption setting of None cannot deliver mail to a remote server, because unencrypted SMTP connections are refused. Choose STARTTLS or SSL.
Every alert carries the deployment's hostname, so a single Slack channel or mailbox fed by several installations can tell them apart.
Each notification carries three things: the summary naming the affected object, the description explaining what the condition means, and a link into the metrics interface showing the data that triggered it. That link's time window is pinned to the moment the alert fired rather than being relative to when it is opened, so it still shows the episode days later once the alert has resolved. Its query is scoped to the workload rather than to the individual pod, because the pod named in an alert has often been replaced by the time anyone follows the link. The link is omitted when no hostname is configured.
Credentials are delivered to Alertmanager as files mounted from a Secret, never written into a ConfigMap. Support bundles copy every ConfigMap, so a webhook or password placed there would travel with them.
Viewing Alerts
Both interfaces require the Observability web interfaces option in addition to alerting. With alerting on but web interfaces off, rules are still evaluated and notifications are still delivered; there is simply no UI.
| Interface | Path | Use it for |
|---|---|---|
| vmalert | /o11y/alerts |
The rules, their configured thresholds, and what is firing now |
| Alertmanager | /o11y/alertmanager |
Grouping and routing, and creating silences |
Both are protected by the same single sign-on as the other observability interfaces. This matters more here than for the read-only dashboards, because Alertmanager's API is unauthenticated and creating a silence is a write.
vmalert also logs every alert state transition to standard output, so a fired alert is collected like any other service log rather than existing only in Alertmanager's memory.
The Built-in Rules
The rule shapes are fixed. Thresholds marked Yes are exposed in the admin console; those marked Values file are adjustable under vmalert.thresholds in the observability chart's values but have no console option; those marked No are fixed.
Workload Saturation
| Alert | Fires when | Default | Tunable |
|---|---|---|---|
PixeePodCpuHigh |
CPU use against the container's configured limit | above 50% for 1 hour | Yes |
PixeePodCpuHighNoLimit |
Absolute CPU cores, for containers with no limit set | above 4 cores for 1 hour | Yes |
PixeePodMemoryHigh |
Working set against the memory limit | above 90% for 15 minutes | Yes |
PixeePodCpuThrottled |
Share of scheduling periods in which the container was throttled | above 25% for 30 minutes | Values file |
PixeePodCpuHighNoLimit exists because a container with no CPU limit has no denominator, so the percentage rule cannot see it at all. Several components run without limits and can consume an entire node.
Workload Health
| Alert | Fires when | Default | Tunable |
|---|---|---|---|
PixeeContainerCrashLooping |
A container is in CrashLoopBackOff |
continuously for 30 minutes | Yes |
PixeeDeploymentReplicasUnavailable |
A Deployment is short of replicas and its rollout has stopped progressing | 15 minutes | No |
PixeeJobFailed |
A Kubernetes Job reports a failed pod | 5 minutes | No |
Both of the first two are written to stay quiet during a normal upgrade. Deployments do crash-loop briefly while dependencies start, measured at one to twelve minutes across two weeks of daily upgrades, so the crash-loop alert waits thirty minutes. That is comfortably past the churn and still well inside the shortest genuine failure observed. A rollout that is merely slow keeps advancing its updated-replica count, so only one that has genuinely stalled alerts.
PixeeJobFailed catches scheduled maintenance work failing silently, such as certificate renewal, cost refresh, and configuration metrics.
Platform Dependencies
| Alert | Fires when | Default | Tunable |
|---|---|---|---|
PixeeCertificateExpiringSoon |
A certificate is approaching expiry | fewer than 14 days remaining | Yes, with a requested certificate |
PixeeScrapeTargetDown |
A metrics target cannot be scraped | 15 minutes | No |
PixeeScrapeTargetDown is the one that keeps the rest honest. If a target stops being scraped, every alert derived from it goes blind rather than green.
There are deliberately no database rules. The deployment runs a single Postgres instance, so there is no replica to fall behind, and the metrics that would describe connection and lock contention are not currently collected.
PixeeCertificateExpiringSoon covers only a certificate this deployment requested. The expiry reading comes from cert-manager, which tracks the certificates it issues; an uploaded certificate is stored as an ordinary Secret that nothing here reads, so its expiry remains yours to monitor. The threshold option appears in the admin console only when a certificate is being requested.
Alert History
Alertmanager holds only what is active now. Once an alert resolves it is gone from its API and its interface. History lives in two other places, both populated automatically.
The Alerts dashboard, under Metrics → Dashboards, is the quickest view: a timeline of every alert that fired, when it cleared, which workload it was about, and which rules fire most often. It reads the ALERTS series that vmalert writes to VictoriaMetrics, so it covers the full metrics retention.
Its last row counts how many times each rule started firing, which is the measure of whether a rule is noisy: a rule that fires once and stays firing for a day is one event, while a rule that fires and clears twenty times is twenty interruptions. It deliberately counts transitions into the firing state rather than into the pending state. An alert that goes pending and clears before its for window elapses never notified anyone, and counting those would report routine deployment churn as noise.
Every panel is a count of what was firing at each moment, so the lines rise as alerts fire and fall as they clear. A cumulative measure such as minutes spent firing over a trailing day only climbs until the event ages out twenty-four hours later, which on a graph reads as a rule that never stops firing; for questions of that shape, query the series directly with the range you want.
For ad-hoc questions, query the same series directly in the metrics interface:
ALERTS{alertstate="firing"}                        # everything currently firing
ALERTS{alertname="PixeeContainerCrashLooping"}     # one rule's whole history
count_over_time(ALERTS{alertstate="firing"}[7d])   # which rules are noisiest
Switching that view to its Table tab gives a plain table of active alerts and their labels.
Alert state transitions are also logged. vmalert writes every INACTIVE → PENDING → FIRING → INACTIVE move to standard output, so the transitions are searchable alongside every other service log, with the full label set and the reason the alert cleared. Log and metric retention are configured separately and may differ, so check both before concluding that an older event was never recorded. In general the dashboard is the better place for questions of when and how often, and the logs are the better place for detail.
Neither depends on Alertmanager being up, which is the point: its own view of the world does not survive a restart.
Reducing Noise
A critical alert suppresses warning-level saturation alerts for the same pod, so a workload that is down reports once rather than several times.
To quiet an alert you already know about, create a silence in the Alertmanager interface rather than changing configuration. Silences are the intended tool, because they are scoped, they expire, and they record who created them and why.
The repeat interval controls how often an alert that is still firing notifies again. It is separate from how long a condition must hold before it fires the first time.
Note
A silenced alert is indistinguishable from a healthy one everywhere except Alertmanager. Support bundles collect active silences for exactly this reason. When reviewing one, check them before concluding that nothing was wrong.
Adding Your Own Rules
Site-specific rules can be appended without modifying the built-in set, using vmalert.extraRuleGroups in the observability chart's values. Entries follow the standard alerting rule format and are added verbatim.
Support Bundles
When alerting is enabled, support bundles capture the rules and their last evaluation, the alerts firing at the time of collection, and any active silences.
The bundle analysis names each alert individually rather than reporting that something fired: every rule appears as its own check, so a bundle shows exactly which alarms were active and what each one means, without anyone opening the raw collector output. The analysis also reports whether vmalert was reachable, whether any rule failed to evaluate, and whether a silence was suppressing anything.
A rule that fails to evaluate is reported as a failure rather than a warning. That rule is blind, not quiet, and an empty alert list is not evidence that nothing is wrong.
Pod Log Storage
Every container's stdout and stderr is written to disk by kubelet before Pixee's log collector ever sees it. Where those files live decides which filesystem fills up when a container logs more than expected, and whether Kubernetes notices in time to protect the node. This page explains when to move them and how to do it at install time. Moving them on a cluster that is already running is a supported migration Pixee support will walk you through.
Why the location matters
kubelet writes container output to a pod log directory, /var/log/pods by default,
and rotates each file once it passes containerLogMaxSize (10 MiB by default). Rotation
is enforced by a periodic sweep rather than a hard filesystem quota, so a container that
writes faster than the sweep runs can leave files far larger than the nominal cap until
the sweep catches up. Rotation limits the steady state; it does not bound the worst case.
Kubernetes has a second defense for exactly that case: kubelet evicts pods when the
filesystem it calls nodefs runs low on space. nodefs is the filesystem backing
kubelet's root directory, which Embedded Cluster places under --data-dir. If pod logs
sit on a different filesystem from --data-dir, that defense cannot see them — pod
logs can fill their volume to 100% while kubelet reports plenty of nodefs space and
never evicts anything.
Moving pod logs onto the --data-dir volume closes both halves at once: the logs get
that volume's headroom, and they land on the filesystem kubelet's eviction thresholds
actually watch.
Do you need this?
Compare the filesystem holding /var/log with the one holding your --data-dir:
df -h /var/log /var/lib/embedded-cluster
Same filesystem — the default single-root layout — and there is nothing to do. Pod logs already share the filesystem kubelet watches, and relocating them within it changes nothing.
Different filesystems, with --data-dir on the larger one, and you have the gap
described above. A host with a small dedicated /var and a large data volume is the
common shape it takes: the large volume has room to spare, the logs go to the small one,
and nothing intervenes before it is full. A full /var takes containerd, the admin
console, and support bundle collection down with it. Relocate the pod log directory.
The destination must be the --data-dir filesystem, not merely a bigger one
Any other volume, however much space it has, leaves you exactly where you started.
kubelet measures free space on the filesystem backing its own root directory, so pod
logs on a third filesystem are invisible to eviction in the same way pod logs on
/var were — the disk just fills up somewhere new. Kubernetes requires the two to
share a filesystem for its accounting to hold. Pick a directory under --data-dir.
What changes about the failure mode
This does not stop a container logging too much; it changes what happens when one does.
Before, pod logs filled a volume Kubernetes was not watching, and the node degraded
with nothing intervening. After, they fill the volume that also holds Pixee's database
and object storage — but kubelet is watching that one, so it starts evicting pods to
protect the node instead of letting it wedge. Recovery becomes a Kubernetes event you
can see rather than a full disk you discover afterwards. Size the --data-dir volume
with that in mind.
Pixee does not set this for you. The path has to name a directory on your
--data-dir volume, and the Embedded Cluster Config supports no template functions, so
any value shipped in a release would be a fixed literal — right for deployments that took
the default --data-dir and wrong for every other one. It stays yours to set.
Relocating at install time
The example throughout this page installs with --data-dir /apps/pixee/embedded-cluster,
so the pod log directory it names is /apps/pixee/embedded-cluster/k0s/pod-logs — the
k0s/pod-logs part is the only piece that is a convention rather than your choice.
Substitute your own data directory everywhere it appears.
Write an overrides file naming a path under it:
# pod-logs-overrides.yaml
apiVersion: embeddedcluster.replicated.com/v1beta1
kind: Config
spec:
  unsupportedOverrides:
    k0s: |
      config:
        spec:
          workerProfiles:
            - name: default
              values:
                podLogsDir: /apps/pixee/embedded-cluster/k0s/pod-logs
Pass it to the installer alongside your data directory:
sudo ./pixee install --data-dir /apps/pixee/embedded-cluster \
  --overrides pod-logs-overrides.yaml
kubelet creates the directory itself on first start; you do not need to pre-create it. Keep the file — Embedded Cluster re-applies these overrides on every upgrade, which is what makes the setting durable.
Then complete Giving the log collector access below. On SELinux-enforcing hosts, also work through Checking SELinux labelling.
Giving the log collector access
Whichever way you set the pod log directory, the log collector needs read access to it. In the admin console, go to Config → Observability, set Pod log directory to the same absolute path, then save and deploy.
This step is not optional, and skipping it fails quietly. The collector finds pod logs
through /var/log/containers, a directory of symlinks that kubelet keeps in place
wherever the pod log directory points. It already has read access to /var/log and
/var/lib, so a path under either of those needs nothing here. A path outside both — such
as one under /apps — leaves the collector resolving symlinks to files it cannot open:
log ingestion stops, and every pod stays Ready with no error to notice.
Helm deployments
On a Helm deployment you manage kubelet yourself, and the equivalent of this step is a
read-only hostPath on the collector. See the commented extraVolumes and
extraVolumeMounts block under victoria-logs-collector in the
pixee-enterprise-server-observability chart's values.yaml — the collector lives in
that sibling chart, not in pixee-enterprise-server. The mount path must equal the
host path, because the symlinks kubelet writes are absolute. Setting
global.pixee.observability.podLogsDir on the main chart is separate: it only reports
the path in support bundles and grants no access.
Relocating on a running cluster
Relocating after installation is a one-time migration. It changes kubelet's configuration and takes effect only when the node reboots, so Pixee is unavailable while the host comes back, and it needs root on the node rather than cluster-admin.
Ask Pixee support for the pod log relocation runbook rather than assembling the steps yourself. It ships as a script that runs the preflight checks, makes the change, and then confirms the part that matters: that every container moved off the old directory and that log collection survived. One of its steps fails silently if taken out of order, which is the reason it is a runbook and not a list of commands.
If the host reports Enforcing, work through
Checking SELinux labelling as part of it.
Checking SELinux labelling
Skip this if getenforce reports Permissive or Disabled. Work through it whenever it
reports Enforcing, whether you relocated at install time or afterwards.
The commands below read your data directory from DATA_DIR, so set it first:
DATA_DIR=/apps/pixee/embedded-cluster # yours, not necessarily this
Hardened images are not covered
Enforcing mode is supported on the standard SELinux policy that Enterprise Linux ships. STIG- and CIS-hardened images are neither supported nor tested, and their policies can deny access that the comparison below cannot anticipate. On one of those, check for denials after the reboot before treating the relocation as done.
Under SELinux, a new directory inherits its parent's type rather than the type kubelet's
default pod log directory carries. If the container runtime is denied write access,
containers start but produce no log output. Placing the directory inside --data-dir,
where containerd and kubelet already read and write their own state, normally gives it a
type they can use — but compare rather than assume:
# The type the new location will inherit
sudo ls -Zd "$DATA_DIR/k0s"

# The type kubelet's default location carries, for comparison
sudo ls -Zd /var/log/pods
Then, once the node has rebooted onto the new directory, check for denials:
sudo ausearch -m AVC -ts recent | grep -iE 'pod-logs|containerd|kubelet' || echo "no denials"
If denials appear, give the new tree the same type the default location carries — read it
from the ls -Zd /var/log/pods output above rather than assuming a value, since it
depends on your distribution's policy — and relabel:
POD_LOG_TYPE=$(sudo ls -Zd /var/log/pods | awk '{print $1}' | cut -d: -f3)
echo "relabelling to $POD_LOG_TYPE"
sudo semanage fcontext -a -t "$POD_LOG_TYPE" "$DATA_DIR/k0s/pod-logs(/.*)?"
sudo restorecon -Rv "$DATA_DIR/k0s/pod-logs"
Upgrades
The setting survives upgrades. Pixee ships no pod log directory of its own, so the override Embedded Cluster re-applies on each upgrade leaves your value in place, whether you set it through an install-time overrides file or afterwards.
Re-run the runbook's verification after your first upgrade anyway, and keep the Pod log directory config option in step with the path if you ever change it.
Reverting
The runbook has a revert command that puts podLogsDir back and reboots the node. Clear
the Pod log directory setting in the admin console afterwards. Bear in mind this restores the
eviction gap described at the top of this page.
Remove the setting from your install-time overrides file too
If you relocated at install time, podLogsDir also lives in the --overrides file you
passed the installer, and Embedded Cluster re-applies that file on every upgrade. Undoing
the change in the cluster configuration alone means the next upgrade puts it back — with
the Pod log directory config option now cleared, so the collector has no access to
the path kubelet returns to using, and log collection stops silently. Edit the overrides
file as part of reverting, and keep it for future upgrades.
Traces
Pixee Enterprise Server includes VictoriaTraces for distributed trace collection. When local metrics is enabled, trace telemetry from the analysis service is automatically collected and stored, allowing you to inspect individual request spans and trace IDs.
Enabling Traces
Traces are automatically collected when local metrics is enabled. See Enabling Local Metrics for instructions.
Trace Sampling
The analysis service head-samples the traces it starts, so only a fraction of analyses produce a trace. The default is chosen to keep trace volume manageable, since the spans that record LLM prompts and completions are by far the largest.
Set the sampling ratio to 1.0 to capture every trace — useful on a quiet environment when verifying that traces arrive end to end. Lower it on a busy environment to trade trace fidelity for retention on the traces volume. Valid values run from 0.0 (no traces) to 1.0 (all traces) — a fraction, not a percentage; the analysis service rejects anything outside that range at startup. Sampling is applied when a trace starts, so it governs every destination the spans are exported to, and it takes effect whenever telemetry is enabled.
Navigate to the admin console, select the Config tab, then go to the Advanced Settings section. Set Analysis trace sampling ratio to a value between 0.0 and 1.0. Leave it blank to keep the analysis service default.
Add the following to your values.yaml:
analysis:
  tracesSampleRatio: "1.0"
Omit the value to keep the analysis service default.
Accessing Traces VMUI
You can access the VictoriaTraces web interface to search and explore traces. You can either enable web access via ingress or use port forwarding.
Option 1: Enable VMUI Web Interface (Ingress)
Enable the VMUI web interface to access the traces query interface directly through your browser.
To enable the VictoriaTraces web interface in Embedded Cluster deployments:
- Navigate to the admin console
- Select the
Configtab - Go to the
Advanced Settingssection - Check the
Enable Traces VMUI web interfaceoption - Save and redeploy the application
Once enabled, access the traces interface at:
https://<your-domain>/traces/select/vmui/
Unauthenticated Access
The VMUI web interface endpoints are not authenticated. Only enable this option if your deployment is within a trusted network or you have implemented external authentication.
To enable the VictoriaTraces web interface in Helm Deployment, add the following to your values.yaml:
victoriatraces:
  server:
    ingress:
      enabled: true
      ingressClassName: "nginx"  # Use your ingress class
      hosts:
        - name: "your-domain.com"
          path:
            - /traces
          port: http
Then upgrade your deployment:
helm upgrade pixee-enterprise-server ./charts/pixee-enterprise-server \
  -f values.yaml \
  -n pixee-enterprise-server
Once enabled, access the traces interface at:
https://your-domain.com/traces/select/vmui/
Unauthenticated Access
The VMUI web interface endpoints are not authenticated. Consider implementing external authentication or only enable this in trusted network environments.
Option 2: Port Forwarding
If you prefer not to expose the VMUI via ingress, you can use port forwarding for temporary access.
Step 1: Create SSH tunnel from your local machine
ssh -L 10428:localhost:10428 pixee@<your-hostname>
Step 2: Set up port forwarding
In the SSH session, run:
sudo ./pixee shell
kubectl -n kotsadm port-forward pixee-enterprise-server-traces-server-0 10428:10428
Step 3: Access the traces interface
Open your browser and navigate to:
http://localhost:10428/traces/select/vmui/
Step 1: Port forward to VictoriaTraces
kubectl port-forward svc/pixee-enterprise-server-traces-server 10428:10428 -n pixee-enterprise-server
Step 2: Access the traces interface
Open your browser and navigate to:
http://localhost:10428/traces/select/vmui/
Querying Traces
VictoriaTraces provides a Jaeger-compatible query API for searching traces. In the VMUI, you can:
- Search by service name — Filter traces from specific services (e.g.,
pixee-analysis-service) - Search by trace ID — Look up a specific trace using its trace ID
- Filter by duration — Find slow requests by setting minimum/maximum duration
- Filter by tags — Search for traces with specific span attributes
Querying Traces Programmatically
Beyond the VMUI, you can query traces over the Jaeger-compatible HTTP API with the Pixee CLI, which authenticates you through your identity provider and supplies a per-user bearer token:
TOKEN=$(pixee auth token --server https://pixee.example.com)
# List services, then search recent traces for one
curl -s -H "Authorization: Bearer $TOKEN" \
  https://pixee.example.com/o11y/traces/select/jaeger/api/services
curl -sG -H "Authorization: Bearer $TOKEN" \
  https://pixee.example.com/o11y/traces/select/jaeger/api/traces \
  --data-urlencode 'service=pixee-analysis-service' --data-urlencode 'limit=20'
See Programmatic Access with the Pixee CLI for the one-time pixee auth login step.
VictoriaTraces Resources
- VictoriaTraces Documentation
- VictoriaTraces Querying - Query API reference
Agent Plugin
Pixee ships as an installable plugin for the coding agent your developers already use. Once installed, the agent can call the Pixee CLI directly — pulling scan results, findings, and fix details — without a developer leaving their agent session to look anything up.
This matters most when closing out a Pixee fix needs a change only your build can validate — passing test coverage gates, lint, or other CI checks Pixee can't see. Rather than building its own CI-feedback loop, Pixee hands that last mile to the coding agent your developers already have configured against your build, tests, and CI.
Supported agents
The plugin currently supports:
- GitHub Copilot CLI
- VS Code (via GitHub Copilot Chat)
- Cursor
- Claude Code
- OpenAI Codex CLI
Tools that don't yet support either plugin format can still install the underlying skills directly through a generic fallback — see the README below for details.
Installing
Full install instructions live in the Pixee CLI README. Pick the section for your agent and follow its install steps — most are one or two commands.
API Access
Pixee Enterprise Server provides a REST API for programmatic access to your Pixee installation. This page explains how to authenticate with the API and access available resources.
There are two ways to authenticate, and which one you want depends on whether a person is present:
| Per-user login | Shared API key | |
|---|---|---|
| Who it identifies | the individual, by name | nobody — one key for the whole deployment |
| Permissions | from your identity provider groups | none; all callers are equivalent |
| Revoking one person | remove them in your IdP | not possible without rotating for everyone |
| Works unattended (CI) | no — needs a browser sign-in | yes |
Prefer the per-user login whenever someone is at a keyboard, so API activity is attributable to a real person. Use the shared key for CI and automation, where nobody can complete a browser sign-in.
Per-User Access with the Pixee CLI
The Pixee CLI signs you in through your deployment's identity provider and holds a short-lived token on your behalf:
pixee auth login --server https://<your-pixee-server>
This prints a URL to approve in your browser. Because approval happens out of band, the browser does not have to be on the machine running the CLI — you can log in over SSH and approve from your laptop, as long as that device can reach your deployment.
Then retrieve a currently-valid bearer token whenever you need one. It refreshes itself, so scripts and coding agents can call this repeatedly without re-authenticating:
TOKEN=$(pixee auth token --server https://<your-pixee-server>)

curl -H "Authorization: Bearer $TOKEN" \
  https://<your-pixee-server>/api/v1/users/me
Your roles come from identity-provider group membership, so a token carries exactly the permissions
your account has — see Authentication for how groups map to Pixee
roles. pixee auth status shows which deployments you are signed in to and when each session
expires.
The same token also reaches the observability endpoints; see Programmatic Access with the Pixee CLI.
Retrieving Your API Key
The shared API key is a single value for the whole deployment. It identifies no one, so prefer the per-user login above for interactive work and reserve this for CI and automation.
To access the Pixee API, you need to retrieve your API key from the admin console.
Step 1: Access the Admin Console
Navigate to your admin console:
- Embedded Cluster:
https://<your-domain>:30000 - Helm Deployment: Access via the configured admin console endpoint
Log in with your admin credentials.
Step 2: Enable and Retrieve the API Key
- Select the Config tab in the admin console
- Scroll to the Authentication section
- Check the Enable Pixee API key checkbox to enable API authentication
- Copy the value from the Pixee API Key field
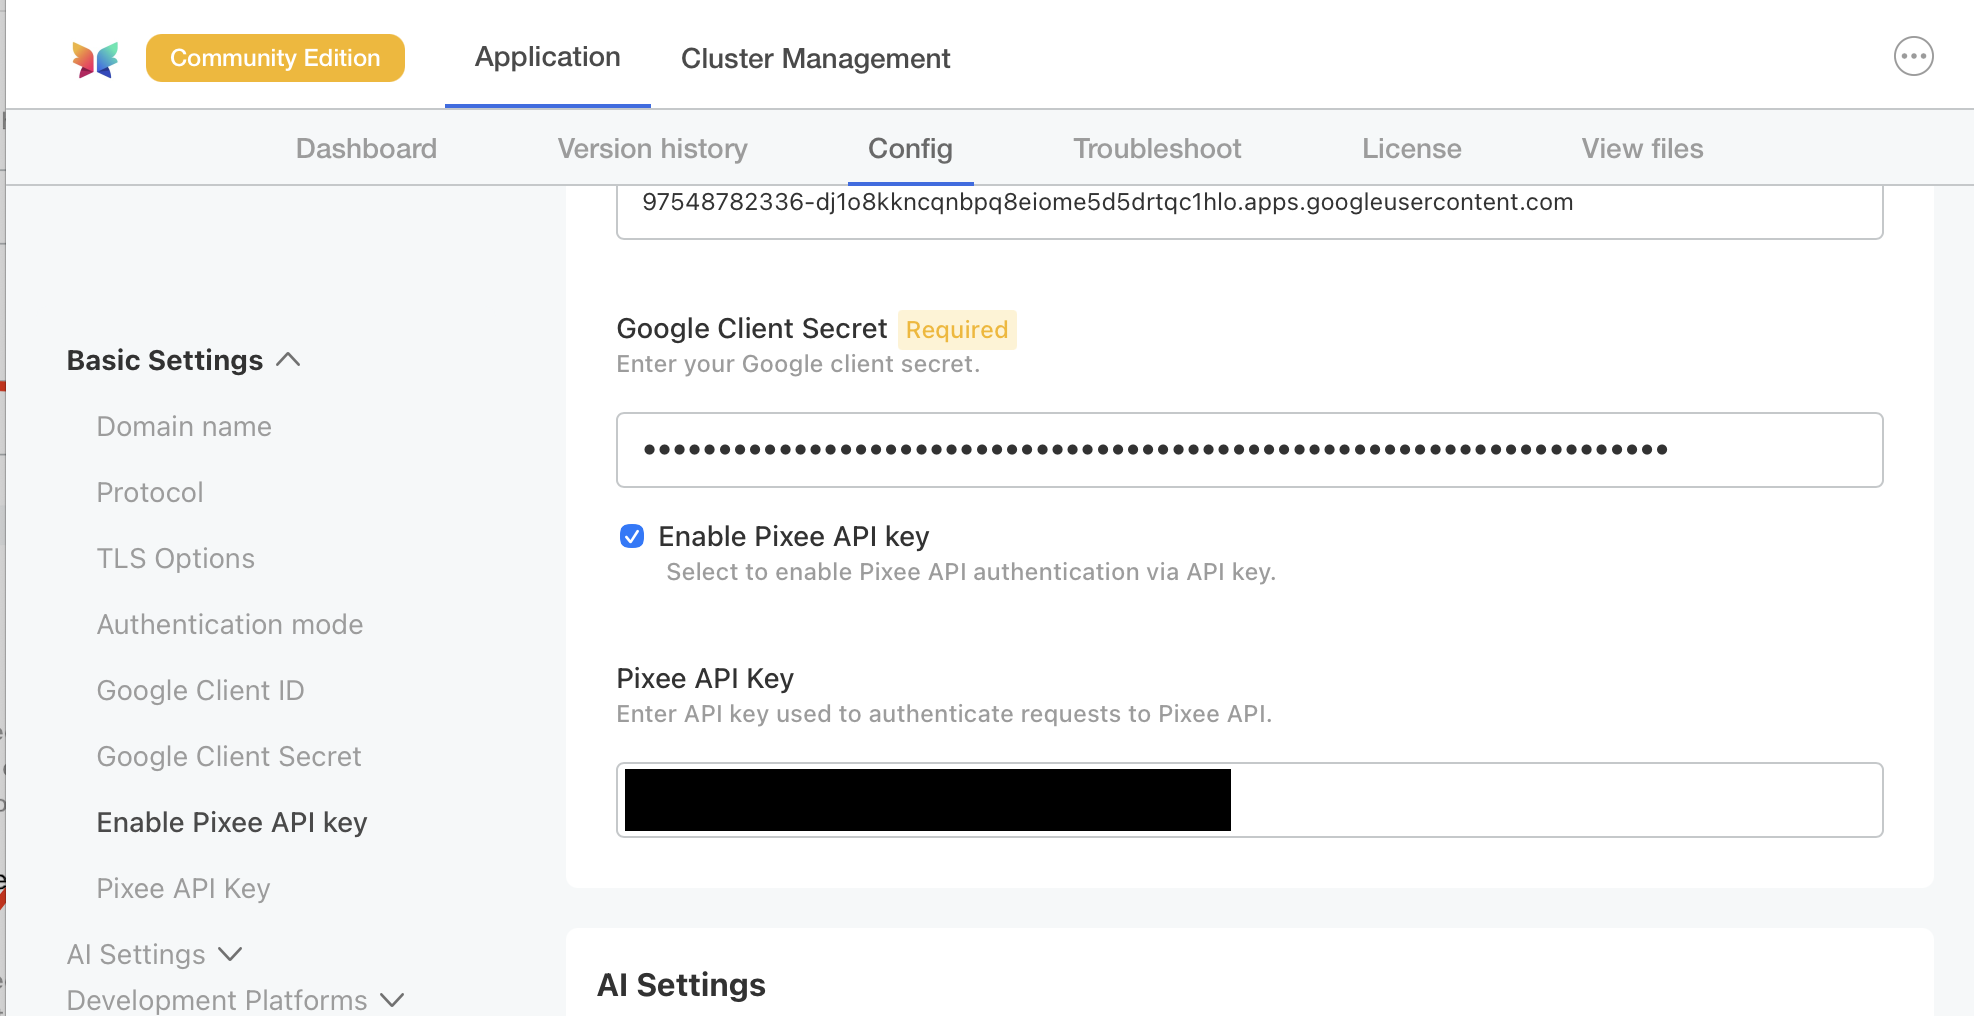
Tip
Store your API key securely. Treat it like a password and avoid committing it to version control or sharing it in insecure channels.
Authentication
The Pixee API uses Bearer token authentication. Include your credential — either a per-user token
from pixee auth token or the shared API key — in the Authorization header of each request.
Example: cURL Request
curl -H "Authorization: Bearer <your-api-key>" \
  https://<your-pixee-server>/api/v1/openapi
Example: Python Request
import requests

headers = {
    "Authorization": "Bearer <your-api-key>"
}

response = requests.get(
    "https://<your-pixee-server>/api/v1/openapi",
    headers=headers
)
API Resources
Pixee Enterprise Server provides two resources for exploring and integrating with the API:
HAL Browser
URL: /api/browser
The HAL Browser provides an interactive web interface for exploring the API with real data from your Pixee installation. Use it to:
- Discover available API endpoints
- Understand the structure of API responses
- Test API calls interactively
OpenAPI Specification
URL: /api/v1/openapi
The OpenAPI specification provides a machine-readable description of the API. Use it to:
- Generate client code in your preferred programming language
- Import into API testing tools like Postman or Insomnia
- Build integrations with automated tooling
To download the specification:
curl -H "Authorization: Bearer <your-api-key>" \
  https://<your-pixee-server>/api/v1/openapi > openapi.json
Support Bundles
A support bundle is a snapshot of your Pixee Enterprise Server cluster (logs, configuration, manifests, and diagnostics) that Pixee Support uses to investigate issues.
Bundles uploaded through any of the paths below are delivered to Pixee Support automatically — you do not need to send the file yourself.
Which path to use
Three entry points coexist. Each produces a bundle that lands in the same place; the differences are who can reach them and how much log content the bundle carries.
| Path | Carries VictoriaLogs? | Reachable by | Best for |
|---|---|---|---|
| Pixee Platform UI (preferred) | Yes | Any authenticated Pixee Platform user | Most cases. The extended bundle is what Pixee Support usually needs to investigate non-trivial issues. |
| kotsadm Admin Console | No | kotsadm administrators only | Cases where Pixee Support has explicitly asked for the standard (non-extended) bundle, or where the in-product flow has been disabled. |
| Cluster shell fallback | Yes | Anyone with VM sudo or a kubeconfig |
Fallback when neither of the other two paths is available — for example, when the Pixee Platform itself is down (so the in-product flow can't run) and the kotsadm Admin Console is unreachable or unusable. |
If you are uncertain which to pick, ask Pixee Support which bundle they want.
Generate from the Pixee Platform UI
- Sign in to the Pixee Platform.
- Click your avatar in the top-right of the navigation bar.
- Choose Generate Support Bundle.
A toast confirms the bundle has started. The bundle is generated in the cluster and uploaded to Pixee automatically. You can close the page; the upload continues in the background. Subsequent toasts report progress as the bundle moves through running and into a terminal state (succeeded or failed).
While your bundle is in flight, the menu item label switches to Generating support bundle… and is disabled in your browser. It re-enables when the bundle reaches a terminal state. Only one bundle can be in flight at a time across the cluster — if another user has a bundle running, you'll see a warning toast identifying them and your request will not run until theirs finishes.
This is the recommended path because it requires no shell access and produces the extended bundle (with Victoria logs) that Pixee Support typically needs.
Generate from the kotsadm Admin Console
The kotsadm Admin Console retains its Generate a Support Bundle and Send bundle to vendor controls. These produce the standard bundle, which does not include the Victoria logs export, and upload it through kotsadm's own pipeline.
- Open the kotsadm Admin Console (
https://<host>:30000). - Click Troubleshoot in the navigation bar.
- Click Generate a Support Bundle.
- Once generation completes, click Send bundle to vendor.
Use this path when Pixee Support has explicitly asked for the standard bundle, or when the in-product flow has been disabled on this installation. For routine investigation, prefer the Pixee Platform UI path — the extended bundle it produces carries the log content Pixee Support relies on.
Generate from the cluster shell
Use this path when the Pixee Platform UI is unavailable — for example, when a deployment fails and leaves the platform itself unreachable. Two commands produce the bundle and upload it to the in-cluster Replicated SDK Service, which forwards it to Pixee.
The kubectl support-bundle CLI also auto-uploads the bundle on its own, but that goes to a Replicated analysis endpoint, not to Pixee — the explicit POST in step 2 is what makes it reach Pixee Support.
Prerequisites
On the Pixee Enterprise Server VM, drop into the cluster shell — kubectl and the support-bundle plugin are already on the PATH:
sudo ./pixee shell
From any machine with a kubeconfig pointing at the cluster, install the support-bundle kubectl plugin:
curl https://krew.sh/support-bundle | bash
Generate and upload
The upload runs inside a one-shot pod using the pixee-utility-alpine image.
Reference all three secrets explicitly rather than using --load-cluster-specs. Auto-discovery only finds the standard spec (labeled troubleshoot.sh/kind=support-bundle); the extended spec is deliberately labeled troubleshoot.pixee.ai/kind=support-bundle-extended so it is not auto-discovered, so --load-cluster-specs alone would produce a thin bundle with no VictoriaLogs export. The third secret carries the redactor rules that mask credential-shaped environment variables the built-in redactors miss; omitting it produces a bundle with those values in cleartext. Copy all three names exactly — support-bundle exits with a spec error and writes no bundle at all if a named secret does not exist, rather than falling back to less redaction. This matches what the in-cluster Job runs.
The extended spec is rendered by the pixee-enterprise-server-observability chart, not the main one. Embedded-cluster installations always deploy it, so all three secrets are present. A plain Helm installation that does not deploy that chart has no extended spec, and the command above exits with a spec error before collecting anything. Check with kubectl get secret -n kotsadm pixee-enterprise-server-support-bundle-extended and drop that line if it is absent; the standard spec and the redactor still produce a usable bundle, without the Victoria exports.
kubectl support-bundle -o bundle.tar.gz \
  secret/kotsadm/pixee-enterprise-server-support-bundle \
  secret/kotsadm/pixee-enterprise-server-support-bundle-extended \
  secret/kotsadm/pixee-enterprise-server-redactor

kubectl run -n kotsadm sb-upload --rm -i --restart=Never \
  --image=images.pixee.ai/proxy/pixee/218200003247.dkr.ecr.us-east-1.amazonaws.com/pixee/pixee-utility-alpine:1.0.20274709409 \
  --command -- sh -c 'cat > /tmp/b.tgz && curl -fsS -X POST \
    -T /tmp/b.tgz \
    -H "Content-Type: application/gzip" \
    http://replicated.kotsadm.svc:3000/api/v1/supportbundle' < bundle.tar.gz
Disabling the in-product flow
The in-product flow runs as a small in-cluster Service backed by a Kubernetes ServiceAccount with cluster-wide read access plus pods/exec and pods/log. The runner ServiceAccount needs that scope so the bundle's collectors can discover and inspect cluster state across namespaces — without it, the bundle would not be useful for diagnosing distributed issues.
To disable the in-product flow entirely:
- Open the kotsadm Admin Console (
https://<host>:30000). - Click Config.
- Find In-product support bundle generation and clear the checkbox.
- Click Save config and deploy the new version.
When disabled:
- The chart renders no Deployment, Service, ConfigMaps, ServiceAccounts, or cluster-scoped RBAC for the support-bundle service.
- The Generate Support Bundle menu item in the Pixee Platform UI is hidden.
- The kotsadm Admin Console's Generate a Support Bundle and Send bundle to vendor controls remain available.
Trade-off
Disabling the in-product flow means Pixee Support cannot receive the extended (Victoria-logs-bearing) bundle through the platform UI. The two remaining paths are:
- The kotsadm Admin Console — produces the standard bundle (no Victoria logs).
- The cluster shell fallback — produces the extended bundle but requires VM
sudoor a kubeconfig.
For most non-trivial investigations Pixee Support needs the extended bundle, so disabling the in-product flow typically means support engineers will ask you to run the cluster-shell path. Bundles delivered that way reach Pixee Support the same way; the difference is operator effort, not destination.
Edge cases
Thin bundle when VictoriaLogs is disabled
If VictoriaLogs is not enabled on this installation, the Generate Support Bundle menu item stays visible and bundles still generate — but the bundle's log collector finds no VictoriaLogs endpoint and the resulting bundle carries no log content. Pixee Support will see a "thin" bundle.
In that state, the kotsadm Send bundle to vendor button produces an equivalent (also-log-free) standard bundle through a different upload pipeline and is the appropriate path.
Bundle retention
Bundles uploaded through any path are retained by Pixee for Support to access. The cluster-side bundle Job (and its pod) are kept for 3 days after completion before Kubernetes auto-deletes them, which is enough time to inspect a failed run via kubectl logs <bundle-runner-pod>.
If none of the paths above produces a bundle, contact Pixee for further support.
Pixee Enterprise Server Frequently Asked Questions
Below are list of frequently asked questions related to Pixee Enterprise Server installation, configuration and operation. If your question is not answered below, please let us know!
How do I send Pixee a support bundle?
The fastest path is the Generate Support Bundle entry under your avatar menu in the Pixee Platform UI — the bundle is generated in-cluster and uploaded to Pixee automatically. A cluster-shell fallback is available for situations where the UI itself is down. See Support Bundles for both flows.
How do I view the pods and logs?
For detailed instructions on viewing pods and logs, see the Observability - Logs & Debugging section.
How do I verify that the GitHub App is successfully sending events to pixee-enterprise-server?
To confirm that events are being properly transmitted from the GitHub App to pixee-enterprise-server, you can review the GitHub App's event log. This log can be accessed through your GitHub App's settings under the "Advanced" section.
GitHub provides detailed documentation on viewing webhook deliveries here.
The event log displays a comprehensive list of all events sent from the GitHub App, along with their respective response codes.
How do I retrieve a file out of SeaweedFS?
Pixee uses SeaweedFS to store CodeTF files and we may ask for those files to help debug issues related to Pixee.
CodeTF files are an interchange format used by the Pixee platform. They represent the results of fixes and therefore can be useful for debugging fix-related issues.
SeaweedFS ports are not exposed by default. To access the SeaweedFS web UI, first create an SSH tunnel from your local machine:
ssh -L 8888:localhost:8888 pixee@<ip>
Then in the SSH session, use the kubectl port-forward command to forward the port:
kubectl port-forward -n kotsadm svc/pixee-enterprise-server-seaweedfs-filer 8888:8888
This will forward the SeaweedFS web UI to port 8888. Remember to kill these commands once you are done. You can then access the SeaweedFS web UI by visiting http://localhost:8888 in your browser to browse and download files.
How do I update the Pixee Enterprise Server embedded cluster admin console domain name and TLS certificate?
If you have registered a domain name for your Pixee Enterprise Server and have a valid TLS certificate and want to replace the self-signed certificate used by the admin console during the initial installation, follow these steps: 1. (optional) Retrieve the TLS certificate and private key from the cluster (skip this step if you already have the cert and key available)
# From the Pixee Enterprise Server virtual machine
sudo ./pixee shell
kubectl get secret pixee-platform-tls-requested -o jsonpath='{.data.tls\.crt}' -n kotsadm | base64 --decode > cert.pem
kubectl get secret pixee-platform-tls-requested -o jsonpath='{.data.tls\.key}' -n kotsadm | base64 --decode > key.pem
# From your local machine
scp pixee@<vm ip address>:/home/pixee/cert.pem ./
scp pixee@<vm ip address>:/home/pixee/key.pem ./
# From the Pixee Enterprise Server virtual machine
sudo ./pixee shell
kubectl -n default annotate secret kotsadm-tls acceptAnonymousUploads=1 --overwrite -n kotsadm
PROXY_SERVER=$(kubectl get pods -A | grep kurl-proxy | awk '{print $2}')
kubectl delete pods $PROXY_SERVER -n kotsadm
ℹ️ The
acceptAnonymousUploadsannotation will be removed after completing the update in the next step
- In a browser visit
https://<vm ip addresss>:30000/tlsand follow the prompts to set the admin console domain name to match the existing Pixee Enterprise Server and upload the TLS certificate and private key - When completed you should be able to browse to the admin console at
https://<domain name>:30000
Clicking "Continue" on the login page redirects to an internal address and times out
The browser is sent to something like https://10.0.90.4/authentik/application/o/authorize/?…&redirect_uri=https://10.0.90.4/… and fails with ERR_CONNECTION_TIMED_OUT.
Pixee builds every browser-facing OIDC URL from the Domain name setting, so the address in that redirect is your configured Domain name. Seeing an internal address there means Domain name was set to the cluster's own address or to the origin address your reverse proxy or CDN was configured with, rather than the public hostname browsers use. Enabling forwarded headers does not help — these URLs are fixed at deploy time, not rebuilt from X-Forwarded-*.
Fix it in two places at once:
- Set Domain name (Network) to the public hostname.
- Configure your proxy to send that same hostname in the
Hostheader — for Azure Front Door this is the origin's Origin host header; see CDNs and Proxies That Rewrite the Host Header.
Changing only Domain name makes the gateway return 404 Not Found for every request, because it serves only the Host that matches Domain name. Changing only the proxy leaves the redirects pointing at the internal address.
If step 2 is not available to you — the proxy belongs to another team, or the product gives you no way to preserve Host — set Domain name to the public hostname anyway and add the address the proxy sends to Additional accepted hostnames, which stops the 404. Validate sign-in afterwards: see When You Cannot Change the Proxy.
After the change, confirm the platform picked it up:
kubectl -n kotsadm get deploy pixee-enterprise-server-platform -o jsonpath='{.spec.template.spec.containers[0].env[?(@.name=="SPRING_SECURITY_OAUTH2_CLIENT_PROVIDER_PIXEE_AUTHORIZATION_URI")].value}{"\n"}'
If that still prints the old host, the config change has not rolled out yet.
I cannot sign in to Pixee. How do I recover access?
Every login goes through the embedded Authentik identity provider, so what to do depends on the symptom: being sent to an identity provider you cannot use is a different problem from an Authentik that cannot reach its database. See Recovering Access When You Cannot Sign In, which has a tab per symptom, including a last-resort break-glass that starts the platform with authentication disabled.
How do I troubleshoot Authentik blueprint errors?
Pixee Enterprise Server uses Authentik blueprints to declaratively configure the OIDC provider, application, and brand settings. Blueprints are automatically discovered and applied by the Authentik worker pod on a periodic cycle (~60 seconds). If a blueprint fails to apply, it enters an error state and will not be retried until the issue is resolved.
Every Login Fails With 400 Invalid client identifier
This is the blueprint failing, not the reverse proxy — and it is worth checking first, because everything else looks healthy. Authentik answers its liveness and readiness endpoints, the admin console reports the app ready, and a support bundle's Authentik health check passes. But the Pixee OIDC Provider blueprint never applied, so the pixee OAuth2 client the platform authenticates against does not exist.
Two things confirm it in seconds, before you look at any proxy:
- The login page renders stock authentik branding rather than Pixee branding, and the
pixee-adminsgroup does not exist. Both come from the same blueprint. - The Authentik server log shows
"event": "Invalid client identifier", "client_id": "pixee".
A blueprint applies atomically, so a single bad entry rolls back every unrelated entry alongside it — the OAuth2 providers, the group, and the brand together. Find the entry that failed in the worker log:
kubectl logs -n <namespace> -l app.kubernetes.io/name=authentik,app.kubernetes.io/component=worker --tail=2000 | grep -i "blueprint validation failed"
If the failure names a host such as accounts.google.com or login.microsoftonline.com, the cluster has no egress to a seeded identity provider's discovery endpoint. Current releases seed those federation sources disabled — Authentik only fetches the discovery document for a source that is enabled — so they validate with no network call at all and this cannot happen; upgrading is the fix. On a release from before that change (6.0.11 and earlier), either allow egress to that host on port 443, or edit configmap/pixee-authentik-blueprint to set the embedded source to enabled: false — the edit unblocks sign-in immediately but is reverted by the next deployment.
Force Re-apply the Blueprint
The quickest way to check for errors and fix them in one step is to force a re-apply. This will print any errors if the blueprint fails, or silently re-apply all settings if it succeeds:
# Find the worker pod
kubectl get pods -n <namespace> -l app.kubernetes.io/name=authentik,app.kubernetes.io/component=worker

# Force re-apply — prints errors on failure, silently succeeds otherwise
kubectl exec -n <namespace> <worker-pod> -- ak apply_blueprint mounted/cm-pixee-authentik-blueprint/pixee-oidc.yaml
If the command succeeds with no error output, the blueprint has been re-applied and the configuration should be current. If it prints errors (e.g., serializer validation errors or missing references), fix the root cause, deploy the fix, and run the command again.
Stale Configuration After Failed Deployments
If a deployment partially failed — for example, the main Helm chart failed to upgrade but the embedded chart succeeded — the blueprint ConfigMap may not have been updated. In this case, even a successful re-apply will use stale content. Verify the ConfigMap has the expected values:
kubectl get configmap pixee-authentik-blueprint -n <namespace> -o jsonpath='{.data.pixee-oidc\.yaml}'
If the content is outdated, resolve the failed deployment first so the ConfigMap gets updated, then re-apply.
Checking Blueprint Status
If you need to check whether the blueprint is in an error state or when it was last applied:
kubectl exec -n <namespace> <worker-pod> -- python3 -c "
import django, os
os.environ.setdefault('DJANGO_SETTINGS_MODULE', 'authentik.root.settings')
django.setup()
from authentik.blueprints.models import BlueprintInstance
for bp in BlueprintInstance.objects.all():
    print(f'{bp.name} | status={bp.status} | last_applied={bp.last_applied}')
"
Note
This command prints Authentik initialization logs before the actual output. The data you need appears at the end.
Blueprint statuses:
successful— Applied without errorserror— Failed to apply; will not be retried automatically until the status is resetunknown— Not yet processed or was manually reset
If a blueprint is stuck in error, reset it and re-apply:
# Reset the status so it can be re-applied
kubectl exec -n <namespace> <worker-pod> -- python3 -c "
import django, os
os.environ.setdefault('DJANGO_SETTINGS_MODULE', 'authentik.root.settings')
django.setup()
from authentik.blueprints.models import BlueprintInstance
bp = BlueprintInstance.objects.get(name='Pixee OIDC Provider')
bp.status = 'unknown'
bp.save()
print('Blueprint status reset to unknown')
"

# Then force re-apply
kubectl exec -n <namespace> <worker-pod> -- ak apply_blueprint mounted/cm-pixee-authentik-blueprint/pixee-oidc.yaml
Deeper Investigation
When the blueprint re-applies successfully but something is still wrong (broken branding, login errors, incorrect redirects), you can inspect what Authentik actually has in its database and compare against what the blueprint declares:
kubectl exec -n <namespace> <worker-pod> -- python3 -c "
import django, os
os.environ.setdefault('DJANGO_SETTINGS_MODULE', 'authentik.root.settings')
django.setup()

from authentik.brands.models import Brand
print('=== Brands ===')
for b in Brand.objects.all():
    print(f'  domain={b.domain} default={b.default} logo={b.branding_logo} favicon={b.branding_favicon} title={b.branding_title}')

from authentik.providers.oauth2.models import OAuth2Provider
print('=== OAuth2 Providers ===')
for p in OAuth2Provider.objects.all():
    print(f'  name={p.name} client_id={p.client_id} redirect_uris={p.redirect_uris}')

from authentik.flows.models import Flow
print('=== Flows ===')
for f in Flow.objects.all():
    print(f'  slug={f.slug} title={f.title} designation={f.designation}')
"
Other useful checks:
# Find the server pod
kubectl get pods -n <namespace> -l app.kubernetes.io/name=authentik,app.kubernetes.io/component=server

# Check for 404 errors (missing logos, broken media references)
kubectl logs -n <namespace> <server-pod> | grep '"status":404'

# Verify logo/favicon files exist on disk
kubectl exec -n <namespace> <server-pod> -- ls -la /data/media/public/
For OIDC or flow issues, update the domain/protocol settings in the Admin Console and redeploy rather than editing the database directly.
For more details, see the Authentik blueprint documentation.
What internet access is necessary for Pixee Enterprise Server?
Pixee Enterprise Server will need access to certain resources on the internet during installation/upgrade and normal operation. All optional resources can be disabled via config/values. If you need complete air gap support, please contact us. The resources are detailed below:
During installation/update:
| Domain | IP Addresses (if available) | Notes |
|---|---|---|
| images.pixee.ai proxy.replicated.com |
see https://github.com/replicatedhq/ips/blob/main/ip_addresses.json#L52-L57 | Pixee container image registry |
| registry.pixee.ai registry.replicated.com |
see https://github.com/replicatedhq/ips/blob/main/ip_addresses.json#L20-L25 | Pixee Helm registry |
| github.com | see api section at https://api.github.com/meta | GitHub integration (optional) |
| api.openai.com | N/A | OpenAI integration (optional) |
| *.api.letsencrypt.org | see Letsencrypt FAQ | TLS certificate requests (optional) |
During normal operation:
| Domain | IP Addresses (if available) | Notes |
|---|---|---|
| distribution.pixee.ai replicated.app |
162.159.133.41 162.159.134.41 2606:4700:7::a29f:8529 2606:4700:7::a29f:8629 |
Metrics reporting |
| sentry.io *.us.sentry.io |
35.186.247.156/32 34.120.195.249/32 |
Crash reporting (optional) |
| github.com | see api section at https://api.github.com/meta | GitHub integration (optional) |
| api.openai.com | N/A | OpenAI integration (optional) |
Helm Values Reference
Common Values
| Name | Description | Required | Default |
|---|---|---|---|
analysis.image.registry |
Analysis service image registry | No | images.pixee.ai |
analysis.image.repository |
Analysis service image repository | No | proxy/pixee/218200003247.dkr.ecr.us-east-1.amazonaws.com/pixee/pixeebot |
analysis.image.pullSecrets |
Analysis image pull secrets (set to {} to disable) |
No | [{name: pixee-registry}] |
analysis.image.tag |
Analysis service image tag | No | see analysis Chart.yaml app version |
analysis.service.type |
Analysis service tyupe | No | ClusterIp |
analysis.serviceAccount.name |
Analysis service account name | No | "" |
analysis.replicaCount |
Number of analysis service replicas | No | 1 |
analysis.resources.requests.cpu |
CPU requests for analysis service | No | None |
analysis.resources.requests.memory |
Memory requests for analysis service | No | None |
analysis.resources.limits.cpu |
CPU limits for analysis service | No | None |
analysis.resources.limits.memory |
Memory limit for analysis service (KOTS: Analysis service memory limit; raise if OOMKilled) | No | 8Gi |
seaweedfs.image.registry |
SeaweedFS image registry (for embedded object store); the tag is not set here, it follows the subchart's appVersion | No | images.pixee.ai/proxy/pixee/index.docker.io |
seaweedfs.global.imagePullSecrets |
SeaweedFS image pull secrets (for embedded object store) | No | [{name: image-pull-secret}] |
seaweedfs.s3.enabled |
Enable SeaweedFS S3 compatibility (for embedded object store) | No | true |
seaweedfs.filer.data.type |
Storage type for filer data (hostPath or persistentVolumeClaim) | No | persistentVolumeClaim (Helm), hostPath (Embedded Cluster) |
seaweedfs.filer.data.size |
Size of filer persistent volume | No | 25Gi |
seaweedfs.filer.data.storageClass |
Storage class for filer PVC (empty = cluster default) | No | "" (uses cluster default) |
seaweedfs.filer.data.hostPathPrefix |
Host path for filer data when using hostPath type | No (if using hostPath) | /var/lib/seaweedfs (Embedded Cluster default) |
seaweedfs.filer.s3.createBuckets |
SeaweedFS buckets to create on install (for embedded object store) | No | pixee-analysis-input |
seaweedfs.s3.priorityClassName |
PriorityClass for the SeaweedFS S3 gateway pod. See global.pixee.priorityClasses.infrastructureClassName |
No | "" |
seaweedfs.filer.priorityClassName |
PriorityClass for the SeaweedFS filer pod | No | "" |
seaweedfs.master.priorityClassName |
PriorityClass for the SeaweedFS master pod | No | "" |
seaweedfs.volume.priorityClassName |
PriorityClass for the SeaweedFS volume pod | No | "" |
global.pixee.objectStore.username |
Object store username (for embedded SeaweedFS) | No | pixeebot |
global.pixee.objectStore.password |
Object store password (for embedded SeaweedFS). Generated per install by KOTS, so Embedded Cluster operators never set it. No default: leaving it empty on a Helm-only install renders neither the pixee-enterprise-server-seaweedfs-s3-config Secret nor the credential Secret, and the SeaweedFS pods stay in ContainerCreating because they mount the former by name |
Yes, for a Helm-only install (unless existingSecret is set) |
None |
global.pixee.objectStore.existingSecret |
Name of an existing Secret holding the object store credential. When set, the chart renders no credential Secret. On the embedded store you must also point seaweedfs.s3.existingConfigSecret and seaweedfs.filer.s3.existingConfigSecret at a Secret carrying a seaweedfs_s3_config key, or the render fails |
No | "" |
global.pixee.objectStore.secretKeys.accessKey |
Key within the credential Secret holding the access key ID | No | accessKey |
global.pixee.objectStore.secretKeys.secretKey |
Key within the credential Secret holding the secret access key | No | secretKey |
global.pixee.objectStore.ttlDays |
Number of days before objects expire in embedded object store | No | 7 |
platform.hostAliases |
Custom host-to-IP mappings for platform pods (/etc/hosts entries) |
No | [] |
platform.image.registry |
Platform service image registry | No | images.pixee.ai |
platform.image.repository |
Platform service image repository | No | proxy/pixee/218200003247.dkr.ecr.us-east-1.amazonaws.com/pixee/pixeebot |
platform.image.pullSecrets |
Platform image pull secrets (set to {} to disable) |
No | [{name: pixee-registry}] |
platform.image.tag |
Platform service image tag | No | see platform Chart.yaml app version |
platform.ingress.enabled |
Enable ingress for the platform service | No | false |
platform.ingress.className |
Ingress controller class name | Yes (if ingress enabled) | None |
platform.ingress.hosts |
List of host configurations | Yes (if ingress enabled) | None |
platform.ingress.tls |
TLS configuration for ingress | No | None |
platform.replicaCount |
Number of platform service replicas | No | 1 |
platform.resources.requests.cpu |
CPU requests for platform service | No | 500m |
platform.resources.requests.memory |
Memory requests for platform service | No | 1Gi |
platform.resources.limits.cpu |
CPU limits for platform service | No | 2000m |
platform.resources.limits.memory |
Memory limits for platform service | No | 8Gi |
platform.livenessProbe.periodSeconds |
How often (in seconds) to run the liveness probe | No | 15 |
platform.livenessProbe.timeoutSeconds |
Seconds to wait for a liveness probe response before counting as a failure | No | 5 |
platform.livenessProbe.failureThreshold |
Consecutive liveness failures before the pod is restarted | No | 5 |
platform.readinessProbe.periodSeconds |
How often (in seconds) to run the readiness probe | No | 10 |
platform.readinessProbe.timeoutSeconds |
Seconds to wait for a readiness probe response before counting as a failure | No | 5 |
platform.readinessProbe.failureThreshold |
Consecutive readiness failures before the pod is removed from load balancing | No | 3 |
platform.service.type |
Service type for platform | No | ClusterIP |
platform.serviceAccount.name |
Platform service account name | No | "" |
platform.threatModelRefreshEnabled |
Automatically refresh repository threat models on SCM events (repo onboarding, pushes to default branch) | No | false |
platform.prFeedbackEnabled |
Capture developer reactions on Pixee-generated pull requests (comments including @PixeeBot mentions, reviews, closes, pushed commits) from GitHub webhooks and write each event to the analysis service's episodic-memory store for case-based reasoning agents. | No | false |
replicated.image.registry |
Replicated SDK image registry (for embedded object store) | No | images.pixee.ai |
replicated.image.repository |
Replicated SDK image repsitory (for embedded object store) | No | proxy/pixee/index.docker.io/replicated/replicated-sdk |
replicated.imagepullSecrets |
Replicated SDK image pull secret, (set to {} to disable) |
No | [{name: pixee-registry}] |
Global Values
| Name | Description | Required | Default |
|---|---|---|---|
global.pixee.domain |
Domain name where Pixee Enterprise Server will be accessible | Yes | None |
global.pixee.gatewayHostnames |
Additional Host header values the gateway answers to, on top of domain. For proxies and CDNs that rewrite Host to the origin address (Azure Front Door, Application Gateway, CloudFront), where the gateway would otherwise return 404 for every request. Accepts a list or a comma-separated string. This widens routing only — every browser-facing URL is still built from domain, so domain must remain the hostname users type in their browser. Set it on the docs and observability charts too, or their routes 404 while the app answers. Cannot be combined with a cert-manager-issued certificate: accepting extra hosts clears the listener hostname the certificate's DNS names are derived from, so the render fails rather than leaving the certificate unissued. Use global.pixee.protocol: http (terminating TLS at the proxy), or keep HTTPS with eg.tls.issuerName empty and supply the certificate yourself via eg.tls.secretName |
No | [] |
global.pixee.protocol |
Protocol to use for accessing Pixee Enterprise Server (http or https) |
Yes | https |
global.pixee.rollout.maxSurge |
Extra pods a Deployment may create above its replica count during a rolling update. Defaults to 0, so a pod is terminated before its replacement is created and reservations are never held twice — on a cluster with no headroom for a surge pod, the overlap costs CPU and buys no availability. The trade is a brief gap per pod during an upgrade. Set 25% where there is room to spare. Applies to the first-party Deployments and, through their own subchart keys, to Authentik and Superset |
No | 0 |
global.pixee.rollout.maxUnavailable |
Pods a Deployment may be missing during a rolling update. Must stay at least 1 when maxSurge is 0, or a rollout can neither add nor remove a pod and stalls outright |
No | 1 |
global.pixee.priorityClasses.infrastructureClassName |
Name of the PriorityClass assigned directly to the embedded PostgreSQL Cluster and the LiteLLM Deployment, and, through authentik.server/authentik.worker/seaweedfs.{s3,filer,master,volume}'s own priorityClassName keys, to the Authentik server/worker and the embedded object store — so the scheduler has a preemption victim when node headroom runs out rather than leaving them Pending indefinitely. LiteLLM is in this tier because enable_litellm now defaults on for embedded installs, making it the path every AI feature's traffic takes. Empty by default: the class itself is cluster-scoped and only exists once pixee-enterprise-server-embedded's own priorityClasses.enabled is also on; setting a name here first leaves these pods referencing a PriorityClass that doesn't exist, which fails admission |
No | "" |
global.pixee.serviceAccount.create |
Create a service account for the pixee enterprise server release | Yes | true |
global.pixee.serviceAccount.name |
Name of service account to create | No | pixee |
global.pixee.access.oidc.client.id |
Client ID for OIDC provider | Yes (if using authentication) | web |
global.pixee.access.oidc.client.secret |
Client secret for OIDC provider | Yes (if using authentication) | secret |
global.pixee.access.oidc.client.existingSecret |
Name of existing secret containing the client secret | No | {} |
global.pixee.access.oidc.client.secretKeys.secretKey |
Secret key containing the client secret | Yes | secret |
global.pixee.access.oidc.client.basePath |
Base path for OIDC endpoints | No | oidc |
global.pixee.access.oidc.session.ageExtension |
Duration to extend the session cookie past access-token expiry so the browser carries a session into the refresh round-trip. Used only when authentik.enabled=true. Accepts Quarkus shorthand (8h) or ISO-8601 (PT8H). |
No | 8h |
global.pixee.ai.enabled |
Enable or disable AI functionality | No | true |
global.pixee.ai.default.provider |
AI provider type. Options: openai, azure, anthropic, azure-anthropic, bedrock-converse, bedrock-mantle |
No | None |
global.pixee.ai.default.apiKey |
AI provider API key for AI features | Yes (if using OpenAI) | None |
global.pixee.ai.default.existingSecret |
Name of existing Kubernetes secret containing AI provider API key (takes precedence over direct key) | No (alternative to direct key) | None |
global.pixee.ai.default.secretKeys.apiKey |
Key within the secret that contains the AI provider API key | Yes | key |
global.pixee.ai.default.endpoint |
AI provider base URL | Yes (for azure, azure-anthropic, bedrock-mantle) |
None |
global.pixee.ai.default.region |
AWS region. Required for bedrock-converse; informational for bedrock-mantle, whose region is already in the endpoint hostname |
Yes (if provider: bedrock-converse) |
"" |
global.pixee.ai.openaiApiType |
OpenAI dialect: chat (/v1/chat/completions) or responses (/v1/responses). Always responses for bedrock-mantle regardless of this value |
No | "chat" |
global.pixee.ai.reasoning.model |
LLM model name for complex reasoning tasks | No | None (service default gpt-5.4-mini) |
global.pixee.ai.reasoning.effort |
Reasoning effort for the reasoning model. OpenAI-family: none, minimal, low, medium, high, xhigh. Anthropic-family: low, medium, high, max |
No | "" |
global.pixee.ai.fast.model |
LLM model name for quick response tasks | No | None (service default gpt-5.4-mini) |
global.pixee.ai.fast.effort |
Reasoning effort for the fast model | No | "" |
global.pixee.ai.webSearch.model |
LLM model name for research tasks needing live web search (SCA CVE research). Ignored when provider: bedrock-converse, which cannot serve web search. Left empty the web search client keeps its search tool and borrows this name from default.model, so live search still runs if that model supports it — set this only to use a different model for research |
No | Inherits default.model; gpt-5.4-mini if that is unset too |
global.pixee.ai.webSearch.effort |
Reasoning effort for the web search model | No | "" |
global.pixee.objectStore.embedded |
Use embedded object store instead of external | No | true |
global.pixee.objectStore.endpoint |
External object store endpoint URL | Yes (if embedded: false) |
None |
global.pixee.objectStore.username |
External object store access key ID | Yes (if embedded: false) |
None |
global.pixee.objectStore.password |
External object store secret access key. Delivered to services through a chart-managed Secret and secretKeyRef, never as a literal pod env var |
Yes (if embedded: false) |
None |
global.pixee.sentry.enabled |
Enable or disable error reporting via Sentry | No | true |
global.pixee.metrics.enabled |
Enable or disable metrics reporting | No | true |
global.pixee.observability.metricsEnabled |
Whether VictoriaMetrics is running in the pixee-enterprise-server-observability sibling chart. This chart cannot read the sibling release's values, so this mirror is what gates the OTLP metrics export and the support-bundle metrics collectors. Set it on both charts, or leave it to KOTS, which drives both from the same Config option |
No | false |
global.pixee.observability.tracesEnabled |
As above for VictoriaTraces: gates the OTLP traces export and the support-bundle trace collectors | No | false |
global.pixee.observability.alertsEnabled |
Whether vmalert and Alertmanager are running in the pixee-enterprise-server-observability sibling chart. Gates the alert-state collectors and analyzers in the support bundle. Requires local metrics, which are the alert rules' data source. Set it on both charts, or leave it to KOTS, which drives both from the same Config option |
No | false |
global.pixee.observability.serviceNamePrefix |
Service-name prefix of the observability release, which the OTLP endpoints and support-bundle collectors address across the release boundary. Correct only because the sibling chart pins its victoria-* Services with fullnameOverride; an unpinned sibling produces unreachable URLs rather than a render error |
No | pixee-enterprise-server |
global.pixee.observability.extendedSpecSecret |
Name of the Secret holding the EXTENDED support-bundle spec, which the pixee-enterprise-server-observability chart renders and the bundle-generation Job reads by name. Empty means that chart is not installed and the Job omits the reference — it must, because troubleshoot fails an unresolvable secret ref before collecting anything, costing the whole bundle rather than just the heavy exports. Set it only alongside that chart |
No | "" |
global.pixee.observability.podLogsDir |
kubelet's pod log directory, when relocated off /var/log/pods. Reported in support bundles; grants no access on its own — the log collector's read-only mount is a victoria-logs-collector value in the pixee-enterprise-server-observability sibling chart. See Pod Log Storage |
No | "" (kubelet default) |
global.defaultStorageClass |
Default storage class to use for PVCs | No | None |
global.pixee.httpProxy |
HTTP proxy server host/address and port (: |
No | None |
global.pixee.httpsProxy |
HTTPS proxy server host/address and port (: |
No | None |
global.pixee.noProxy |
Comma separates list of hosts to exclude from HTTP/HTTPS proxy | No | None |
global.pixee.privateCACert |
Name of a ConfigMap containing PEM-encoded CA certificates to add to trust stores | No | "" |
global.pixee.skipSSLVerification |
(Deprecated) Disable SSL cert verification for platform. Use privateCACert instead |
No | false |
Custom Values
| Name | Description | Required | Default |
|---|---|---|---|
analysis.agenticTriageAnalyzerStrategy |
Agentic triage analyzer strategy: decision-tree, react, react-holistic, claude-agent, anthropic-agent | No | decision-tree |
analysis.aiCodegenStrategy |
AI code generation strategy (agentic-fast, agentic-native) | No | agentic-fast |
analysis.backpressureEnabled |
Enable backpressure algorithm to proactively cancel analyses that cannot complete within timeout limits | No | true |
analysis.llmConcurrencyEnabled |
Enable AIMD adaptive concurrency limiter for LLM requests. When false, Retry-After backoff still works. | No | false |
analysis.enableProjectContext |
Enable project-level contextual analysis to inform triage and fix results | No | true |
analysis.tracesSampleRatio |
Head-sampling ratio (0.0-1.0) for traces the analysis service roots; governs every span exporter, Sentry included. Applied whenever telemetry is enabled; empty uses the analysis service default | No | "" (service default) |
analysis.enableScaChainResolution |
Experimental. Enable the SCA chain resolution prefilter as a pre-step in the SCA orchestrator (direct and transitive flows) | No | false |
analysis.guardrailDetectionEnabled |
Master switch for heuristic guardrail-rewrite detection on LLM responses. When false, the detector is skipped entirely (no metrics, breadcrumbs, or abort) | No | true |
analysis.guardrailShortCircuitEnabled |
When true, fix retry loops abort on a guardrail detection. When false, detection still runs (metrics and breadcrumbs preserved) but retries do not abort. No effect when guardrailDetectionEnabled is false |
No | true |
analysis.useAgenticTriageForAllRules |
Route all triage rules through the agentic analyzer (always enabled, retained for backward compatibility) | No | true |
analysis.useScaExploitabilityToShortcircuitFix |
Skip fix generation for findings that SCA determines are not exploitable | No | false |
analysis.enableVendoredFileTriage |
Use a specialized triage strategy for vendored files | No | true |
analysis.cache.enabled |
Enable URL-based analysis input caching | No | true |
analysis.cache.defaultTtlSeconds |
Default TTL in seconds for cached analysis inputs | No | 86400 |
analysis.cache.maxSizeBytes |
Maximum cache size in bytes | No | 10737418240 (10GB) |
analysis.cache.honorCacheControl |
Honor cache-control headers from source | No | true |
analysis.cache.directory |
Override cache directory path | No | "" (service default) |
analysis.scaMaxRequestsToAnalyze |
Maximum number of requests to analyze during SCA | No | 5 |
analysis.scaQueueNumWorkers |
Number of workers in the dedicated SCA analysis queue | No | 2 |
analysis.scaQueueMaxSize |
Maximum size of the SCA task queue (0 = unbounded) | No | 0 |
analysis.scaBackpressureEnabled |
Enable backpressure for the SCA analysis queue | No | false |
analysis.database.name |
Logical database name for analysis-service episodic memory | No | analysis_service |
analysis.database.username |
Database user for analysis-service | No | analysis |
analysis.database.password |
Database password (ignored when existingSecret is set) |
Yes (if using analysis DB without existingSecret) |
"" |
analysis.database.host |
Database hostname for external database deployments | Yes (if platform.database.embedded: false) |
"" |
analysis.database.port |
Database port | No | 5432 |
analysis.database.existingSecret |
Name of existing secret with username and password keys |
No | "" |
platform.database.embedded |
Use embedded database instead of external | No | true |
platform.database.host |
External database hostname | Yes (if embedded: false) |
None |
platform.database.port |
External database port | No | 5432 |
platform.database.name |
External database name | No | pixee_platform |
platform.database.username |
External database username | Yes (if embedded: false) |
None |
platform.database.password |
Password for the role that owns the platform database. Has no default on purpose — a shipped one becomes the effective password wherever it is not overridden. Without this or existingSecret the chart renders no credential Secret, and the platform pod cannot start. |
Yes (unless existingSecret is set) |
"" |
platform.database.existingSecret |
Name of existing secret containing a password key. On an embedded cluster it backs the owner role, so it must use the literal keys username/password and should carry the label cnpg.io/reload: "true" — without that label a later password change reaches PostgreSQL only at the operator's next reconcile. |
No | "" |
platform.database.secretKeys.usernameKey |
Key holding the username in the database secret. Must be username when platform.database.embedded: true; the chart refuses to render otherwise. |
No | username |
platform.database.secretKeys.passwordKey |
Key holding the password in the database secret. Must be password when platform.database.embedded: true; the chart refuses to render otherwise. |
No | password |
cloudnative-pg.superuserPassword |
Password for the embedded cluster's postgres superuser. No default, for the same reason as platform.database.password; without it the cluster's superuserSecret is never rendered. |
Yes (if platform.database.embedded: true, unless cloudnative-pg.existingSecret is set) |
"" |
cloudnative-pg.existingSecret |
Name of an existing kubernetes.io/basic-auth secret holding the superuser credentials |
No | "" |
platform.crypto.masterKeyV1 |
Master key used to encrypt tool-integration credentials at rest (ignored when existingSecret is set). Must be a base64-encoded 32-byte value (e.g. head -c 32 /dev/urandom \| base64). KOTS installs auto-generate this; Helm installs must provide it or existingSecret, otherwise the platform pod fails to start. |
Yes (Helm installs, unless existingSecret is set) |
"" |
platform.crypto.existingSecret |
Name of an existing secret containing the master key under the key named by secretKeys.masterKeyV1Key |
No | "" |
platform.crypto.secretKeys.masterKeyV1Key |
Name of the data key within the crypto secret that holds the v1 master key | No | master-key-v1 |
platform.crypto.activeKeyVersion |
Active version of the credential-encryption master key (maps to pixee.crypto.active-key-version) |
No | v1 |
platform.integrationManagement.enabled |
Allow organization users to create, edit, and delete tool-integration instances (credentials) directly in User Platform (Organization → Integrations); when false they see a read-only list of integration names and types only. Independent of RBAC. Maps to PIXEE_INTEGRATIONS_MANAGEMENT_ENABLED. See Tool Connections and Instances |
No | false |
platform.gitCloneStrategy |
Git clone strategy for VCS operations (partial or full) | No | partial |
platform.gitBranchPrefix |
Optional prefix for Git branch names created by Pixee | No | None |
platform.gitCommitMessagePrefix |
Optional prefix for Git commit messages created by Pixee. Applies to every SCM, so it is the wrong place for an SCM-specific reference — for the Azure DevOps work item reference, set platform.scm.azure.workItemId instead |
No | None |
platform.gitAuthorEmail |
Email address for Git commit authorship by the Pixee service account | No | None |
platform.gitAuthorUsername |
Username for Git commit authorship by the Pixee service account | No | None |
platform.proxy.enabled |
Honor X-Forwarded-* / Forwarded headers when reconstructing per-request absolute URLs. Already implied by an https external protocol, so it only needs setting when a proxy terminates TLS and the cluster serves HTTP |
No | false |
platform.inputBucket |
Custom name for analysis input bucket | No | pixee-analysis-input |
platform.inputSignatureDuration |
Duration for pre-signed URLs (e.g., "1h", "30m") | No | None |
platform.analysisQueueMaxConcurrency |
Maximum number of analyses the platform dispatches concurrently to the analysis service. Leave unset to use the platform default. | No | None |
platform.analysisTimeout |
Tier 1 idle timeout — analysis times out if no event (keepalives included) or callback arrives within this window (e.g., "15m", "30m") | No | 15m |
platform.analysisMaxProgressStall |
Tier 2 progress-stall timeout — analysis times out if no result outcome completes within this window; reset only by completed outcomes, not keepalives. Must be greater than platform.analysisTimeout (e.g., "45m", "1h") |
No | 45m |
platform.sastAnalysisTimeout |
Deprecated — superseded by analysisTimeout/analysisMaxProgressStall; still honored if set. SAST-specific idle timeout (e.g., "20m", "30m") |
No | None |
platform.scaAnalysisTimeout |
Deprecated — superseded by analysisTimeout/analysisMaxProgressStall; still honored if set. SCA-specific idle timeout (e.g., "45m", "1h") |
No | None |
platform.github.appName |
GitHub App name | No | None |
platform.github.appId |
GitHub App ID | No | None |
platform.github.appWebhookSecret |
GitHub App webhook secret | No | None |
platform.github.appPrivateKey |
GitHub App private key | No | None |
platform.github.url |
GitHub Enterprise URL | No | None |
platform.github.existingSecret |
Name of existing secret containing GitHub App webhook and private key (takes precedence over setting appWebhookSecret directly) | No | None |
platform.github.secretKeys.appWebhookSecretKey |
Secret key containing the appWebhookSecret | No | appWebhookSecret |
platform.github.secretKeys.appPrivateKeySecretKey |
Secret key containing the appPrivateKey | No | appPrivateKey |
platform.scm.azure.authType |
Azure DevOps authentication method: PAT (personal access token) or SPN (Entra service principal). SPN is supported only against Azure DevOps Services (dev.azure.com). |
No | PAT |
platform.scm.azure.organization |
Azure DevOps organization name | No | None |
platform.scm.azure.workItemId |
Azure DevOps work item ID linked to every pull request Pixee opens, for repositories that enforce the "Require linked work item" branch policy. Also inserted as a #<ID> reference at the front of the commit messages Pixee writes on Azure DevOps repositories, so it does not need to be repeated in platform.gitCommitMessagePrefix. Requires the credential to have Work Items (Read & Write); with Code-only access the link is silently discarded. |
No | None |
platform.scm.azure.token |
Azure DevOps personal access token (used when authType is PAT) |
No | None |
platform.scm.azure.spn.tenantId |
Entra tenant (directory) ID (used when authType is SPN) |
No | None |
platform.scm.azure.spn.clientId |
Entra application (client) ID (used when authType is SPN) |
No | None |
platform.scm.azure.spn.clientSecret |
Entra service-principal client secret (used when authType is SPN) |
No | None |
platform.scm.azure.existingSecret |
Name of existing secret containing Azure DevOps token, webhook password, and service-principal client secret (takes precedence over setting them directly) | No | None |
platform.scm.azure.secretKeys.tokenKey |
Key within the secret that contains the Azure DevOps token | Yes | token |
platform.scm.azure.secretKeys.webhookPasswordKey |
Key within the secret that contains the Azure DevOps webhook password | Yes | webhookPassword |
platform.scm.azure.secretKeys.clientSecretKey |
Key within the secret that contains the Entra service-principal client secret | Yes | clientSecret |
platform.scm.gitlab.baseUri |
Self-hosted GitLab base URI | No | None |
platform.scm.gitlab.token |
GitLab personal access token (required scopes: api, read_user, read_repository, read_api, write_repository, ai_features, read_registry, read_virtual_registry). A service account token is recommended. |
No | None |
platform.scm.gitlab.webhookSecret |
GitLab webhook secret | No | None |
platform.scm.gitlab.memberProjectsOnly |
When false, omits the membership=true filter when listing GitLab projects — for self-hosted GitLab where the service account has broad read access via group or admin permissions rather than explicit project membership |
No | true |
platform.scm.gitlab.existingSecret |
Name of existing secret containing GitLab token and webhookSecret (takes precedence over setting token directly) | No | None |
platform.scm.gitlab.secretKeys.tokenKey |
Key within the secret that contains the GitLab token | Yes | token |
platform.scm.gitlab.secretKeys.webhookSecretKey |
Key within the secret that contains the GitLab webhookSecret | Yes | webhookSecret |
platform.scm.bitbucket.username |
BitBucket username (used for Git clone/push operations) | No | None |
platform.scm.bitbucket.emailAddress |
BitBucket account email (used for REST API authentication with the API token) | No | None |
platform.scm.bitbucket.apiToken |
BitBucket API token (replaces the deprecated app password) | No | None |
platform.scm.bitbucket.existingSecret |
Name of existing secret containing the BitBucket API token (takes precedence over setting apiToken directly) | No | None |
platform.scm.bitbucket.secretKeys.apiTokenKey |
Key within the secret that contains the BitBucket API token | Yes | apiToken |
platform.pixeebot.omitPixeeBacklinks |
When true, PRs opened by pixeebot omit backlinks to User Platform |
No | false |
platform.pixeebot.appscan.apiKeyId |
AppScan key ID | No | None |
platform.pixeebot.appscan.apiKeySecret |
AppScan key secret | No | None |
platform.pixeebot.appscan.webhook.user |
AppScan webhook username for basic authentication | No | None |
platform.pixeebot.appscan.webhook.password |
AppScan webhook password for basic authentication | No | None |
platform.pixeebot.appscan.existingSecret |
Name of existing secret containing AppScan API key, webhook user and password (takes precedence over setting apiKeySecret, webhook.user and webhook.password directly) | No | None |
platform.pixeebot.appscan.secretKeys.apiKeySecretKey |
Key within the secret that contains the AppScan API key | Yes | apiKeySecret |
platform.pixeebot.appscan.secretKeys.webhookUserKey |
Key within the secret that contains the AppScan webhook username | Yes | webhookUser |
platform.pixeebot.appscan.secretKeys.webhookPasswordKey |
Key within the secret that contains the AppScan webhook password | Yes | webhookPassword |
platform.sonar.token |
SonarQube personal access token | No | None |
platform.sonar.webhookSecret |
SonarQube webhook secret | No | None |
platform.sonar.baseUri |
SonarQube server base URI | Yes (if type is server) | None |
platform.sonar.organization |
SonarQube Cloud organization key. Required when authenticating with a scoped organization token | No | None |
platform.sonar.gitHubAppName |
SonarQube GitHub app name | No | None |
platform.sonar.existingSecret |
Name of existing secret containing SonarQube token and webhookSecret (takes precedence over setting token directly) | No | None |
platform.sonar.secretKeys.tokenKey |
Key within the secret that contains the SonarQube token | Yes | token |
platform.sonar.secretKeys.webhookSecretKey |
Key within the secret that contains the SonarQube webhookSecret | Yes | webhookSecret |
platform.sonar.excludeMaintainabilityFindings |
Exclude maintainability findings (code smells) | No | false |
platform.sonar.excludeReliabilityFindings |
Exclude reliability findings (bugs) | No | false |
platform.sonar.cweIds |
Comma-separated list of CWE IDs to filter findings. When set, overrides filterCweTop25 and additionalCweIds |
No | None |
platform.sonar.filterCweTop25 |
(Deprecated) Filter to include only CWE Top 25 findings. Use cweIds instead |
No | false |
platform.sonar.additionalCweIds |
(Deprecated) Comma-separated list of additional CWE IDs to include. Use cweIds instead |
No | None |
platform.sonar.maxFindingsPerScan |
Maximum number of findings to retrieve per scan | No | 10000 |
platform.veracode.apiKeyId |
Veracode key ID | No | None |
platform.veracode.apiKeySecret |
Veracode key secret | No | None |
platform.veracode.existingSecret |
Name of existing secret containing Veracode apiKeySecret (takes precedence over setting accessToken directly) | No | None |
platform.veracode.secretKeys.apiKeySecretKey |
Key within the secret that contains the Veracode apiKeySecret | Yes | apiKeySecret |
platform.arnica.apiKey |
Arnica API key | No | None |
platform.arnica.existingSecret |
Name of existing secret containing Arnica API key (takes precedence over setting apiKey directly) | No | None |
platform.arnica.secretKeys.apiKeyKey |
Key within the secret that contains the Arnica API key | Yes | apiKey |
platform.blackduck.accessToken |
Black Duck access token | No | None |
platform.blackduck.existingSecret |
Name of existing secret containing Black Duck access token (takes precedence over setting accessToken directly) | No | None |
platform.blackduck.secretKeys.accessTokenKey |
Key within the secret that contains the Black Duck access token | Yes | accessToken |
platform.checkmarx.region |
Checkmarx AST region (US, US2, EU, EU2, DEU, ANZ, IND, SNG, MEA) | No | US |
platform.checkmarx.tenantAccountName |
Checkmarx tenant account name | No | None |
platform.checkmarx.apiKey |
Checkmarx API key | No | None |
platform.checkmarx.existingSecret |
Name of existing secret containing Checkmarx API key (takes precedence over setting apiKey directly) | No | None |
platform.checkmarx.secretKeys.apiKeyKey |
Key within the secret that contains the Checkmarx API key | Yes | apiKey |
platform.polaris.enabled |
Enable Polaris (Black Duck) integration | No | false |
platform.polaris.baseUri |
Base URI of your Polaris server | No | https://polaris.blackduck.com |
platform.polaris.apiToken |
Polaris API token | No | None |
platform.polaris.existingSecret |
Name of existing secret containing Polaris API token (takes precedence over setting apiToken directly) | No | None |
platform.polaris.secretKeys.apiTokenKey |
Key within the secret that contains the Polaris API token | Yes | apiToken |
oidc.ingress.enabled |
Enable ingress for OIDC service | No | false |
oidc.ingress.className |
Ingress controller class name for OIDC | No | None |
superset.database.existingSecret |
Name of existing secret containing Superset PostgreSQL credentials (kubernetes.io/basic-auth with username and password keys) |
No | "" |
superset.workerConcurrency |
Celery prefork children in the Superset worker. Left unset, Celery sizes the pool from the node's CPU count — a CPU limit throttles time but does not hide cores, so an 8-core node forks 8 children, each loading the whole Superset app, and the pod OOM-kills itself against its memory limit. Raise only alongside superset.supersetWorker.resources |
No | 2 |
superset.readOnlyRole.enabled |
Create a read-only PostgreSQL role for Superset's analytical connection, so dashboards do not authenticate as the platform's owner role. Read access comes from pg_read_all_data, which covers tables added by later schema migrations. |
No | true |
superset.readOnlyRole.username |
Name of the read-only role | No | superset_ro |
superset.readOnlyRole.password |
Password for the read-only role. Must not change across upgrades — Superset stores a copy in its saved connection. KOTS generates and persists this automatically. | No | "" |
superset.readOnlyRole.existingSecret |
Name of existing secret containing the read-only role's credentials (kubernetes.io/basic-auth with username and password keys) |
No | "" |
superset.readOnlyRole.connectionLimit |
Cap on simultaneous Superset connections, so it cannot consume enough of max_connections to starve the platform (KOTS: Superset Database Connection Limit). PostgreSQL rejects over-limit connections rather than queueing, and a dashboard open issues one per chart and per filter, so keep this well above a full dashboard plus a SQL Lab export. The ceiling runs in both directions: this connection gets 128 MB of sort memory per sort or hash operation — not per connection — and one dashboard query can hold several at once, so roughly 64 operations fit under an 8Gi limit. Raise cloudnative-pg.postgresql.resources.limits.memory alongside this rather than on its own. |
No | 40 |
authentik.database.existingSecret |
Name of existing secret containing Authentik PostgreSQL credentials (kubernetes.io/basic-auth with username and password keys) |
No | "" |
authentik.server.priorityClassName |
PriorityClass assigned to the Authentik server pod. See global.pixee.priorityClasses.infrastructureClassName — KOTS sets both to the same class for embedded-cluster installs; a Helm-only operator sets it directly |
No | "" |
authentik.worker.priorityClassName |
PriorityClass assigned to the Authentik worker pod. See global.pixee.priorityClasses.infrastructureClassName |
No | "" |
authentik.federation.pixeeIdp.token |
Scoped Authentik API token for the in-cluster pixee-idp federation helper (CLI runner that automates per-IdP setup). The helper has no separate enable flag — it deploys automatically whenever authentik.enabled is true and a token is available. KOTS generates this automatically for embedded installs; supplying one is how a plain Helm install activates the helper. Ignored when existingSecret is set. |
No | "" |
authentik.federation.pixeeIdp.existingSecret |
Name of an existing secret holding the pixee-idp token (key token, override via secretKeys.token) — activates the helper without the chart rendering its own pixee-idp-token secret. When set, token is ignored. |
No | "" |
authentik.federation.pixeeIdp.secretKeys.token |
Key within the pixee-idp secret that contains the API token | Yes | token |
cloudnative-pg.postgresql.parameters.maxConnections |
Maximum number of PostgreSQL connections | No | 200 |
cloudnative-pg.postgresql.parameters.sharedBuffers |
PostgreSQL shared buffer memory (recommended: 25% of memory limit) | No | 1GB |
cloudnative-pg.postgresql.parameters.effectiveCacheSize |
Planner hint for available cache memory | No | 3GB |
cloudnative-pg.postgresql.parameters.workMem |
Per-operation memory for sorts and hashes | No | 16MB |
cloudnative-pg.postgresql.parameters.maintenanceWorkMem |
Memory for VACUUM and index creation | No | 256MB |
cloudnative-pg.postgresql.parameters.randomPageCost |
Planner cost for random page access (lower for SSD) | No | 1.1 |
cloudnative-pg.postgresql.parameters.checkpointCompletionTarget |
Checkpoint I/O spread target (0.0-1.0) | No | 0.9 |
cloudnative-pg.postgresql.parameters.logLockWaits |
Log lock wait events for debugging | No | on |
cloudnative-pg.postgresql.probes.liveness.timeoutSeconds |
Liveness probe timeout for the embedded PostgreSQL pod. The CloudNativePG instance manager serves /healthz from the Postgres container, so a saturated primary stops answering while still serving queries; the CNPG default of 5s with 3 failures restarts a database that is working but slow. |
No | 10 |
cloudnative-pg.postgresql.probes.liveness.failureThreshold |
Consecutive liveness failures before the pod is restarted | No | 6 |
cloudnative-pg.postgresql.probes.liveness.periodSeconds |
Liveness probe interval | No | 15 |
cloudnative-pg.postgresql.probes.readiness.timeoutSeconds |
Readiness probe timeout. Withdrawing the -rw endpoint on a single-instance cluster removes the only endpoint every service uses, with nowhere to fail over to. |
No | 10 |
cloudnative-pg.postgresql.probes.readiness.failureThreshold |
Consecutive readiness failures before the endpoint is withdrawn | No | 6 |
cloudnative-pg.postgresql.probes.readiness.periodSeconds |
Readiness probe interval | No | 10 |
cloudnative-pg.postgresql.resources.requests.memory |
Memory request for PostgreSQL pod (KOTS: Database Memory Request). Defaults to the same value as the limit, and should stay there: both the kernel OOM killer and kubelet's eviction ranking pick on a pod using more than it requested, so a lower request makes the primary the first thing the node kills under memory pressure — at peak Superset sort load, which is when it is least affordable. Raise it in step with limits.memory. |
No | 8Gi |
cloudnative-pg.postgresql.resources.requests.cpu |
CPU request for PostgreSQL pod (KOTS: Database CPU Request) | No | 1 |
cloudnative-pg.postgresql.resources.limits.memory |
Memory limit for PostgreSQL pod (KOTS: Database Memory Limit) | No | 8Gi |
cloudnative-pg.postgresql.resources.limits.cpu |
CPU limit for PostgreSQL pod (KOTS: Database CPU Limit). Keep above peak concurrent query load — throttling the container also throttles its health checks. Empty omits the ceiling. | No | 8 |