Metrics & Dashboards
Pixee Enterprise Server includes Victoria Metrics for local metrics collection and visualization. Pre-configured dashboards are automatically deployed to help monitor host and per-workload resource usage, the platform and analysis services (including AI service and per-finding task metrics), and the shared PostgreSQL database.
Enabling Local Metrics
Before accessing Metrics dashboards, you must enable local metrics collection in your deployment.
To enable local metrics collection in Embedded Cluster deployments:
- Navigate to the admin console
- Select the
Configtab - Go to the
Advanced Settingssection - Check the
Enable Local Metricsoption - Save and redeploy the application
To enable local metrics collection in Helm Deployment, add the following to your values.yaml:
global:
  pixee:
    localMetrics:
      enabled: true
Then upgrade your deployment:
helm upgrade pixee-enterprise-server ./charts/pixee-enterprise-server \
  -f values.yaml \
  -n pixee-enterprise-server
Accessing Metrics Dashboards
After enabling local metrics, you can access the Metrics dashboards to view real-time metrics and custom dashboards. You can either enable web access via ingress or use port forwarding.
Option 1: Enable VMUI Web Interface (Ingress)
Enable the VMUI web interface to access metrics dashboards directly through your browser without port forwarding.
To enable the VMUI web interface in Embedded Cluster deployments:
- Navigate to the admin console
- Select the
Configtab - Go to the
Advanced Settingssection - Check the
Enable VMUI web interfaceoption - Save and redeploy the application
Once enabled, access the dashboards at:
https://<your-domain>/metrics/vmui/#/dashboards
Unauthenticated Access
The VMUI web interface endpoints are not authenticated. Only enable this option if your deployment is within a trusted network or you have implemented external authentication.
To enable the VMUI web interface in Helm Deployment, add the following to your values.yaml:
victoria-metrics-single:
  server:
    ingress:
      enabled: true
      ingressClassName: "nginx"  # Use your ingress class
      hosts:
        - name: "your-domain.com"
          path:
            - /metrics
          port: http
Then upgrade your deployment:
helm upgrade pixee-enterprise-server ./charts/pixee-enterprise-server \
  -f values.yaml \
  -n pixee-enterprise-server
Once enabled, access the dashboards at:
https://your-domain.com/metrics/vmui/#/dashboards
Unauthenticated Access
The VMUI web interface endpoints are not authenticated. Consider implementing external authentication or only enable this in trusted network environments.
Option 2: Port Forwarding
If you prefer not to expose the VMUI via ingress, you can use port forwarding for temporary access.
Step 1: Create SSH tunnel from your local machine
ssh -L 8428:localhost:8428 pixee@<your-hostname>
Step 2: Set up port forwarding
In the SSH session, run:
sudo ./pixee shell
kubectl -n kotsadm port-forward pixee-enterprise-server-metrics-server-0 8428:8428
Step 3: Access the dashboards
Open your browser and navigate to:
http://localhost:8428/metrics/vmui/#/dashboards
Tip
Keep the SSH tunnel and port-forward running while viewing the dashboards.
Step 1: Port forward to Metrics
kubectl port-forward pixee-enterprise-server-metrics-server-0 8428:8428 -n pixee-enterprise-server
Step 2: Access the dashboards
Open your browser and navigate to:
http://localhost:8428/metrics/vmui/#/dashboards
Available Dashboards
Pixee Enterprise Server ships four pre-configured dashboards, organized by service and by shared infrastructure. Each opens with all of its panels expanded.
System
Cluster and host resource usage across the Pixee deployment:
- CPU / Memory Utilization (host): overall node CPU and memory usage
- CPU cores used (top 15 workloads) and Memory working set (top 15 workloads): per-workload resource usage, scoped to Pixee's own workloads
- Top pods by CPU throttled ratio: pods that are hitting their CPU limits (CFS throttling)
- Top pods by memory
Platform
The platform service:
- Container resources: CPU cores used, CPU throttled ratio, configured CPU limit, and memory working set for the platform pods
- JVM: heap and non-heap memory, garbage collection and allocation, threads, and classes
- HTTP: active requests and request latency
- JDBC Pool (HikariCP): connection pool activity, sizing, acquire/creation times, and timeouts
Analysis
The analysis service, including AI service and per-finding task metrics:
- Container resources: CPU cores used, CPU throttled ratio, configured CPU limit, and memory working set for the analysis pods
- AI Service Requests Rate: request volume by model, status, and status code
- AI Service Latency Percentiles: p50, p95, and p99 latency by model and status
- AI Service Retry Rate: retry frequency across services
- AI Service Rate Limit Events: rate limiting occurrences
- AI Health Check Latency Percentiles: health check performance (p50, p95, p99)
- Per-Finding Task Counts by Type and Status: task distribution and completion rates
- Token Usage p50 by Task Type and Model: median token consumption per task type and model
Database
PostgreSQL (CloudNativePG), shared by every service:
- Connections: backends by database and state, backends waiting on locks, max transaction duration, and total backends
- Storage & WAL: database size, write-ahead log (WAL) size on disk, and WAL generation rate
- Health: Postgres up and last-collection-error status
Example: Troubleshooting Analysis Latency
One of the most common use cases for the metrics dashboards is troubleshooting slow analysis performance. The AI Service Latency Percentiles panel — in the Analysis dashboard — is particularly useful for identifying which AI models are contributing to latency issues.
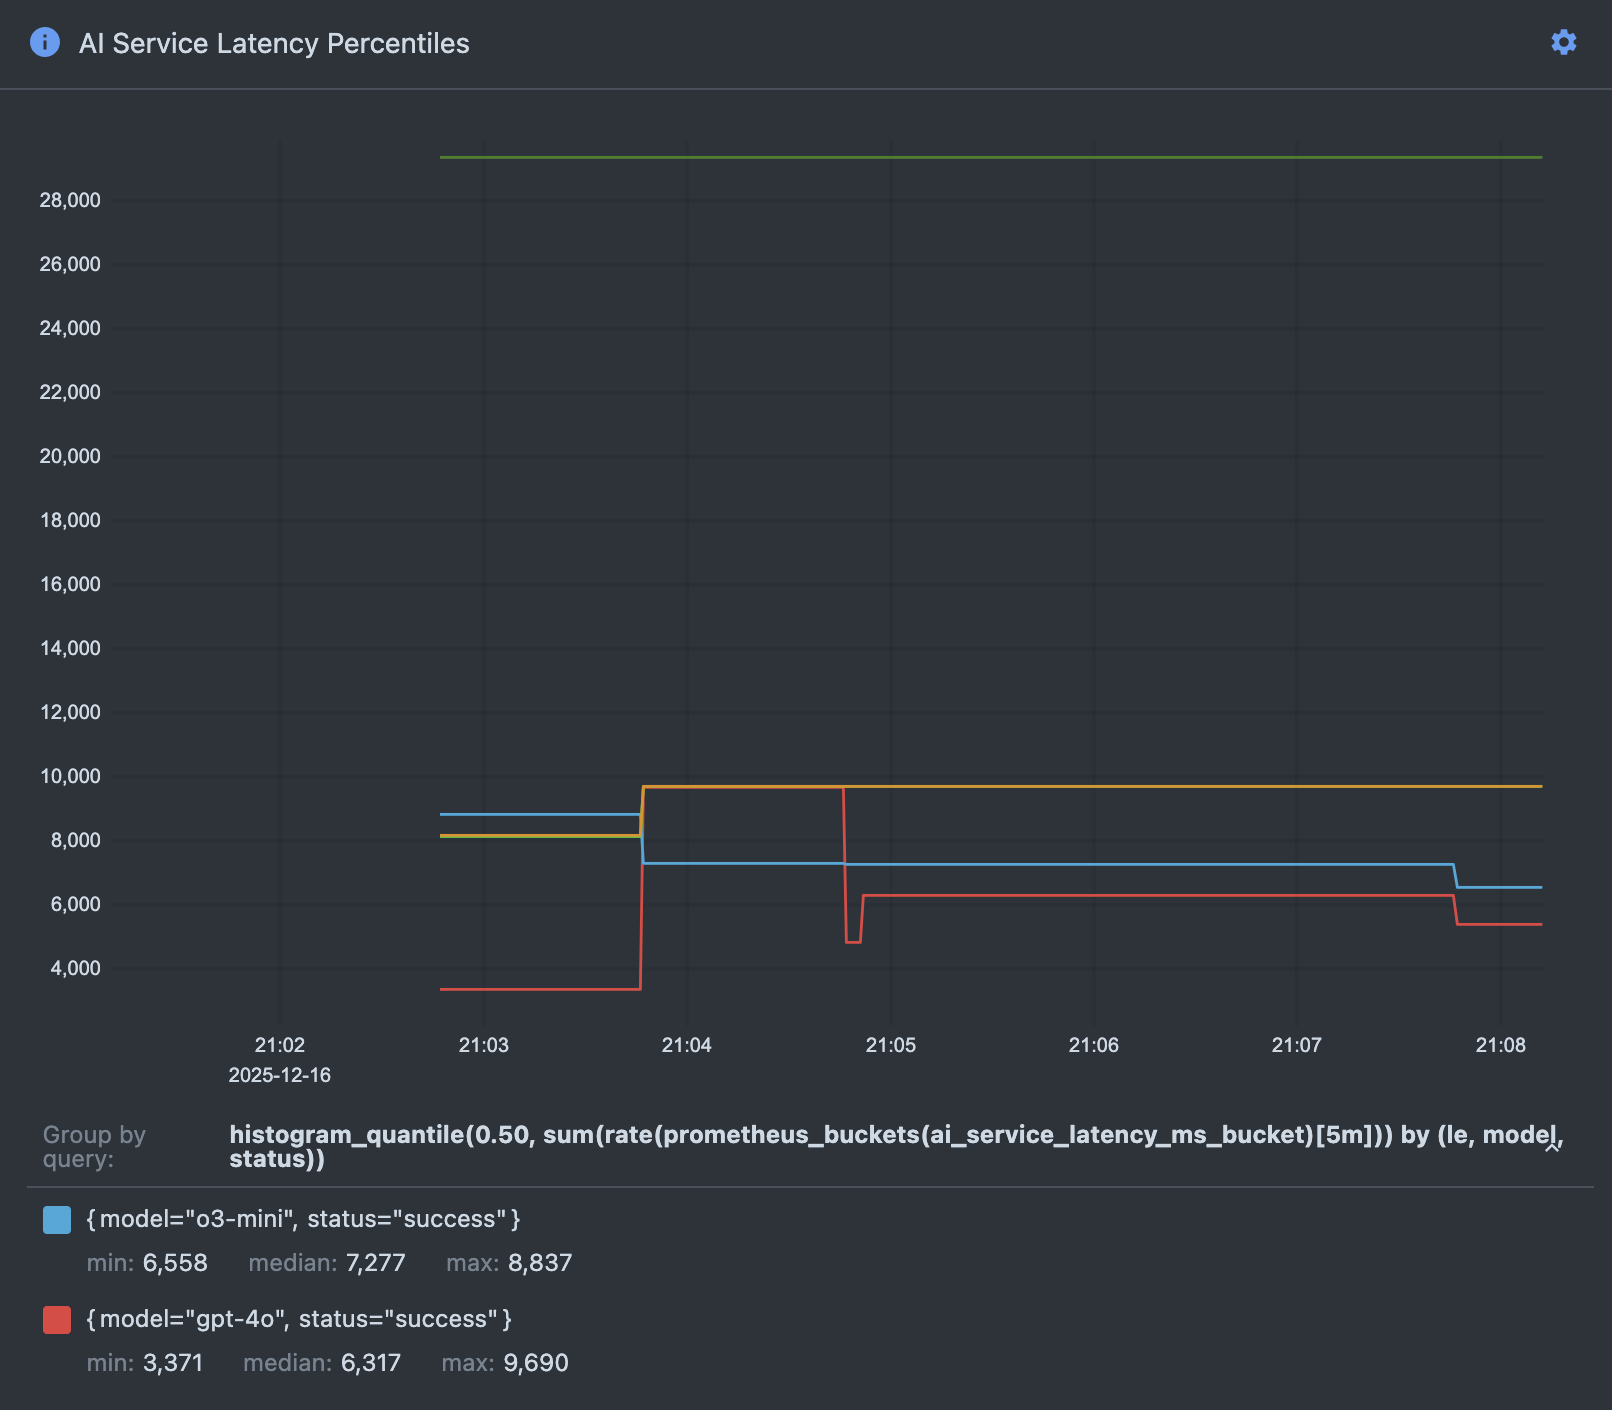
Understanding the Latency Percentiles Graph
The AI Service Latency Percentiles panel displays three key metrics for each AI model over time:
- p50 (Median): The median latency - half of all requests complete faster than this value, half complete slower. This represents typical performance.
- p95: 95% of requests complete faster than this value. This helps identify performance outliers while filtering out the worst 5%.
- p99 (Maximum): 99% of requests complete faster than this value. This captures near-worst-case performance and helps identify extreme latency spikes.
Each AI model (e.g., gpt-5.4-mini) has its own set of percentile lines on the graph, allowing you to compare performance across models and identify which models are experiencing latency issues.
Troubleshooting Scenario
If users report that analysis is taking longer than expected:
-
Open the Analysis dashboard and find the AI Service Latency Percentiles panel, following the steps in Accessing Metrics Dashboards
-
Identify the time period when the slowdown occurred using the time range selector in VMUI
-
Compare latency across models:
- Look for models with elevated p50 values - this indicates consistently slow performance
- Check for spikes in p95 or p99 values - this indicates intermittent latency issues
-
Compare current latency values to historical baselines to confirm degradation
-
Correlate with other metrics:
- Check the AI Service Requests Rate dashboard to see if increased request volume is causing the latency
- Review the AI Service Rate Limit Events dashboard to see if rate limiting is delaying requests
-
Examine the AI Service Retry Rate to identify if failed requests are causing delays
-
Take action based on findings:
- If a specific model shows consistently high latency, consider switching to an alternative model or contacting the AI service provider
- If rate limiting is occurring, adjust request rates or increase service quotas
- If all models show elevated latency during specific time periods, investigate external factors (network issues, AI service outages, etc.)
Dashboard Updates
Dashboards reload automatically
When dashboards are added or updated during an upgrade, Victoria Metrics reloads them from its mounted configuration automatically — no pod restart is required. Just refresh the VMUI page; the change appears within a minute or so.
If updated dashboards still don't appear, you can force a reload by restarting the Metrics pod:
# For Embedded Cluster
kubectl rollout restart statefulset pixee-enterprise-server-metrics-server -n kotsadm

# For Helm Deployment
kubectl rollout restart statefulset pixee-enterprise-server-metrics-server -n pixee-enterprise-server
Monitor the restart progress:
# For Embedded Cluster
kubectl rollout status statefulset pixee-enterprise-server-metrics-server -n kotsadm

# For Helm Deployment
kubectl rollout status statefulset pixee-enterprise-server-metrics-server -n pixee-enterprise-server
User-Created Dashboards Are Not Persisted
Custom dashboards created through the Metrics UI are stored in browser localStorage and are not persisted to the cluster. They will be lost when:
- The pod restarts
- You clear your browser cache
- You access Metrics from a different browser or device
To preserve custom dashboards:
- Export them as JSON files before pod restarts
- Save the JSON files to your local filesystem
- Re-import them after the pod restart
Victoria Metrics VMUI
Victoria Metrics provides a powerful UI (VMUI) for querying and visualizing metrics beyond the pre-configured dashboards.
Accessing VMUI
Access the full VMUI interface at:
http://localhost:8428/metrics/vmui/
VMUI Features
From the VMUI, you can:
- Execute PromQL queries: Write custom queries to explore your metrics
- Create custom visualizations: Build charts and graphs for any metric
- Explore available metrics: Browse all collected metrics and their labels
- View and create dashboards: Access pre-configured dashboards or create your own
- Export data: Download metrics data for offline analysis
Useful PromQL Queries
Here are some example queries you can run in VMUI:
# View all metric names
{__name__!=""}

# AI service request rate (last 5 minutes)
rate(ai_service_requests[5m])

# AI service latency by model
histogram_quantile(0.95, sum(rate(ai_service_latency_ms_bucket[5m])) by (le, model))

# Per-finding task counts by status
sum by(status) (per_finding_tasks)
Metrics Retention
Metrics are retained for 3 days by default. This retention period balances observability needs with storage requirements.
Adjusting Retention Period
To adjust the retention period in Embedded Cluster deployments:
- Navigate to the admin console
- Select the
Configtab - Go to the
Advanced Settingssection - Update the
Metrics retention periodfield (e.g., 3d, 7d, 30d, 1y) - Save and redeploy the application
The new retention period will be applied automatically during the deployment.
To adjust the retention period in Helm Deployment, add the following to your values.yaml:
victoria-metrics-single:
  server:
    retentionPeriod: "7d"  # Options: 3d, 7d, 30d, 1y, etc.
Then upgrade your deployment:
helm upgrade pixee-enterprise-server ./charts/pixee-enterprise-server \
  -f values.yaml \
  -n pixee-enterprise-server
The new retention period will be applied automatically during the deployment.
Troubleshooting
Port Forward Fails
If port forwarding fails, verify the pod is running:
# For Embedded Cluster
kubectl get pod pixee-enterprise-server-metrics-server-0 -n kotsadm

# For Helm Deployment
kubectl get pod pixee-enterprise-server-metrics-server-0 -n pixee-enterprise-server
If the pod is not running, check the pod logs:
# For Embedded Cluster
kubectl logs pixee-enterprise-server-metrics-server-0 -n kotsadm

# For Helm Deployment
kubectl logs pixee-enterprise-server-metrics-server-0 -n pixee-enterprise-server
Dashboards Not Appearing
If dashboards don't appear after an upgrade:
- Verify local metrics is enabled (see Enabling Local Metrics)
- Restart the Metrics pod (see Dashboard Updates)
- Clear your browser cache and refresh the page
- Check that you're accessing the correct URL:
http://localhost:8428/metrics/vmui/#/dashboards
No Metrics Data
If dashboards show no data:
- Verify local metrics has been enabled for at least a few minutes (metrics need time to accumulate)
- Ensure you have run at least one Pixee analysis to generate metrics data (trigger a repository scan, PR analysis, or other Pixee operation)
- Check that the analysis and platform services are running and processing work
- Verify the time range selector in VMUI is set appropriately (default is "Last 30 minutes")
Additional Resources
- VictoriaMetrics Documentation
- MetricsQL Query Language - VictoriaMetrics query language (PromQL-compatible with extensions)
- VMUI Documentation - VictoriaMetrics web UI guide
- PromQL Query Examples